2026 IRAN WAR - What it means for the world economy
The 2026 Iran war and what it means for the Global Economic & the Supply Chain Consequences
MACRONEWSGEOPOLITICAL
Rafael CARRARA
4/4/202619 min read


The IEA's Executive Director Fatih BIROL also gave his most detailed public assessment of the crisis in conversation with Nicolai Tangen, CEO of Norges Bank Investment Management — manager of the world's largest sovereign wealth fund (Norway's $1.8 trillion oil fund). The full episode is on Youtube. Key exchanges below:
Q: How does this compare to the 1973 and 1979 oil crises?
Birol: "When you look at 1973 and 1979, in both of them we lost each about 5 million barrels per day of oil. These oil crises led to global recession in many countries. Today, we lost 12 million barrels per day — more than two of these oil crises put together."
Q: What happens in April?
Birol: "The next month, April, will be much worse than March. In March, there were still some cargo ships that had transited the Strait before the war broke out — they are still coming to ports, still bringing oil and energy. In April, there is nothing."
Q: What is the most urgent supply problem right now?
Birol: "The biggest problem today is the lack of jet fuel and diesel. These are the main challenges and we are seeing it already in Asia, but soon, in April or maybe beginning of May, it will come to Europe."
Q: Can releasing emergency oil reserves solve this?
Birol: "This is only helping to reduce the pain, it will not be a cure. The cure is opening up the Strait of Hormuz. We are gaining some time, but I don't claim that this will be a solution, our stock release."
Q: How long could rationing last?
Birol: "In many countries, the rationing of energy may be coming soon. We are assessing the market on a daily, if not hourly, basis, 24/7."
Q: What does this mean for Europe — including the topic of energy mistakes?
Birol: "The Middle East crisis surpasses all previous energy shocks combined. Europe made three historic energy mistakes: over-reliance on Russian gas, stepping back from nuclear power, and slow renewable build-out. The future of transportation is electric, and cheap electricity will determine who wins the AI race."
The Energy Shock: oil & gas
"A week ago or certainly two weeks ago, I would have said: if the war stopped that day, the long-term implications would be pretty small. But what we're seeing is infrastructure actually being destroyed, which means the ramifications of this war are going to be long-lived." — Christopher Knittel, Energy Economist, MIT. Source: Fortune / Associated Press, March 29, 2026. (https://fortune.com/2026/03/29/global-economy-impact-iran-war-gas-price/)
Executive Summary
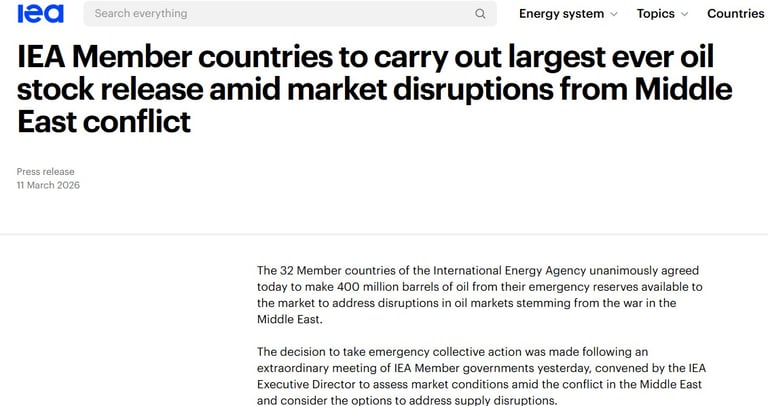
The U.S.-Israeli military campaign against Iran, launched on February 28, 2026, has produced what the International Energy Agency (IEA) characterizes as the largest supply disruption in the history of the global oil market. The conflict has simultaneously impaired oil production, natural gas exports, refining capacity, and a broad array of critical industrial supply chains, generating compound economic shocks across energy, agriculture, finance, and technology sectors worldwide.
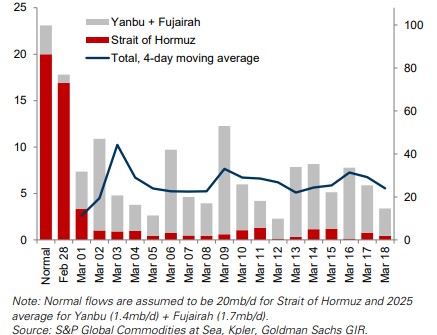
The most immediate mechanism of disruption is the effective closure of the Strait of Hormuz, through which approximately 20 million barrels per day (mb/d) of crude oil and petroleum products transit. The IEA's March 2026 topic page notes this represents approximately 25% of the world's seaborne oil trade and nearly one-fifth of global LNG trade. As of the date of this report, tanker traffic through the Strait has fallen to less than 10% of pre-war levels.
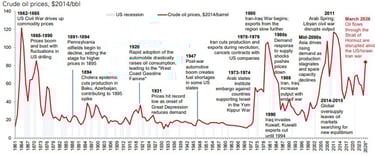
Now let's examine that claim being made by the IEA Executive Director Fatih Birol that : "When you look at 1973 and 1979, in both of them we lost each about 5 million barrels per day of oil. These oil crises led to global recession in many countries. Today, we lost 12 million barrels per day — more than two of these oil crises put together."
Because that raises the question :
Is this really the worst energy disruption in modern history ?
Let us look at it :

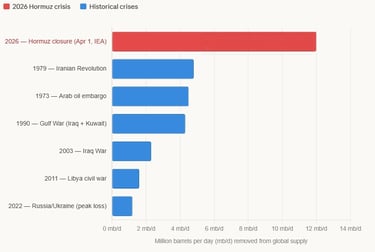
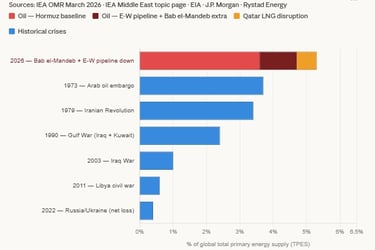
The IEA Executive Director Fatih BIROL is right in saying that in the number of barrel per day lost it is equivalent to the 70s oil shock and the ukrain war put together. But people would be right to point out that the demand has increased since the 70s and it isn't a fair comparison to compare the significance of the crisis with those metrics.
So let us look at the hormuz crisis taking this into account :

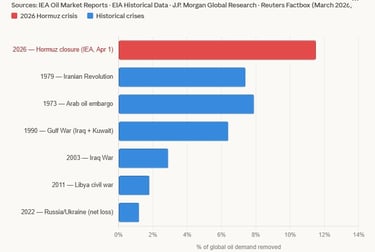
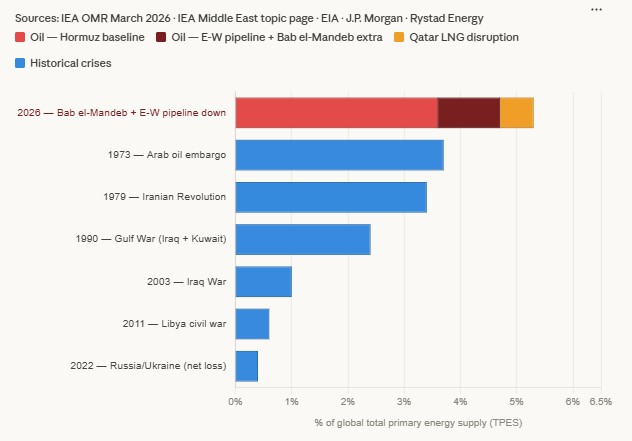
So still the worst energy crisis in modern history but not as bad as the 3 different crisis combined. Furthermore, people would be right to point out that during that time the energy mix of the world has changed with renewables and nuclear for example. We should thus look at the disruption in terms of percentage of total energy demand :

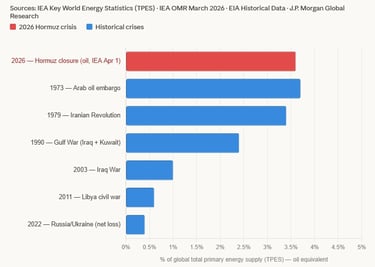
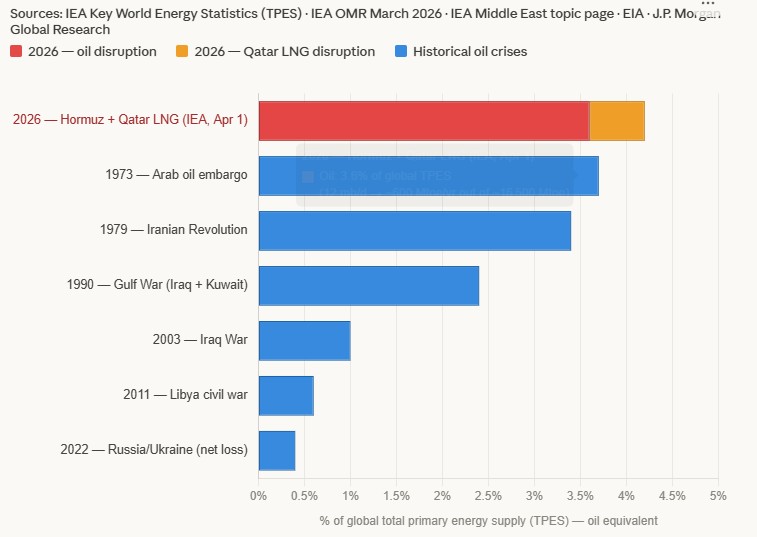
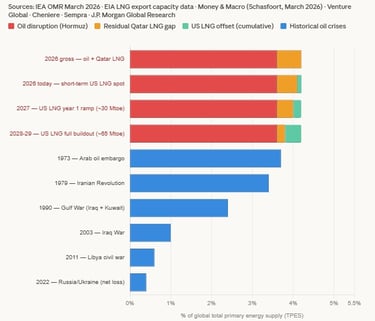
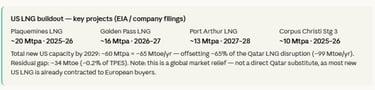
Now, the crisis looks a lot more manageable and is not the worst energy crisis we have faced. But not so fast, this is only taking into account in term of barrels lost per day. If we take into account LNG lost from Quatar here is what we have :

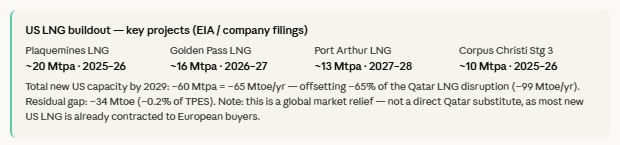
But people in the energy sector would be right to point out that there is a lot of US capacity that is supposed to come online in the next 3 years. Though in the short term that capacity is not able to be increased significantly. Here is what we have if we take this into account :
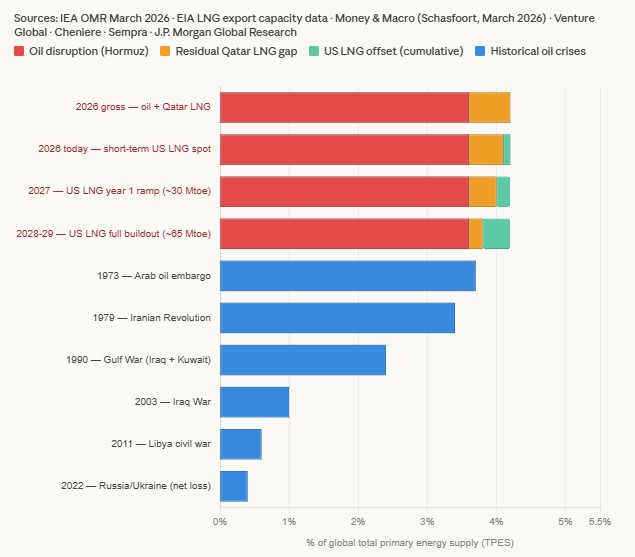
But this would be forgetting rising energy demand :
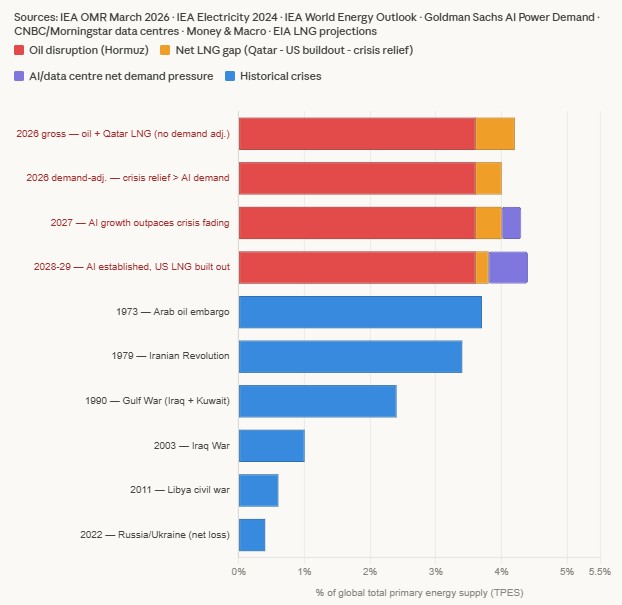

Still, as we can see we are indeed facing the worst energy crisis in modern history in terms of energy supply disruption just as the executive director of the IEA was telling us. Though, it is not as bad as the 70s and ukraine put together in terms of disruption and is only similar to the 73 and 79 oil shocks yet. (which is already quite bad)
And the key word is yet because the conflict isn't over and there is the potential for further disruption.
Let's assess the situation together. Here is the total demand of oil for the world according to the IEA :
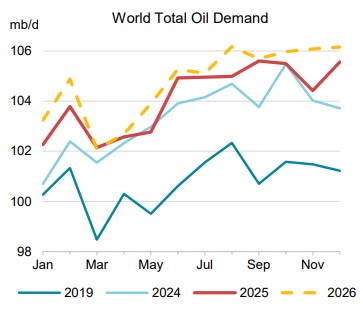
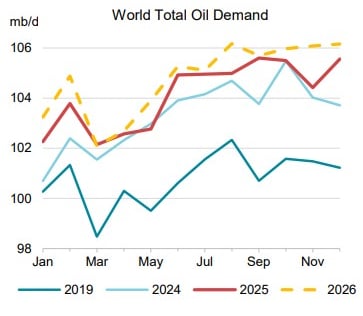
So the total world demand for oil is around 105 million barrels per day.
But the oil market is split in two parts. There is a pipeline market and there is a seaborne market. And when it comes to prices, the seaborne market is really where it's at. If you're sitting in China, you're buying oil from the Middle East, all of a sudden, it's not available. Sure, if there is a pipeline that goes from Canada into the United States, that doesn't really help you all that much.
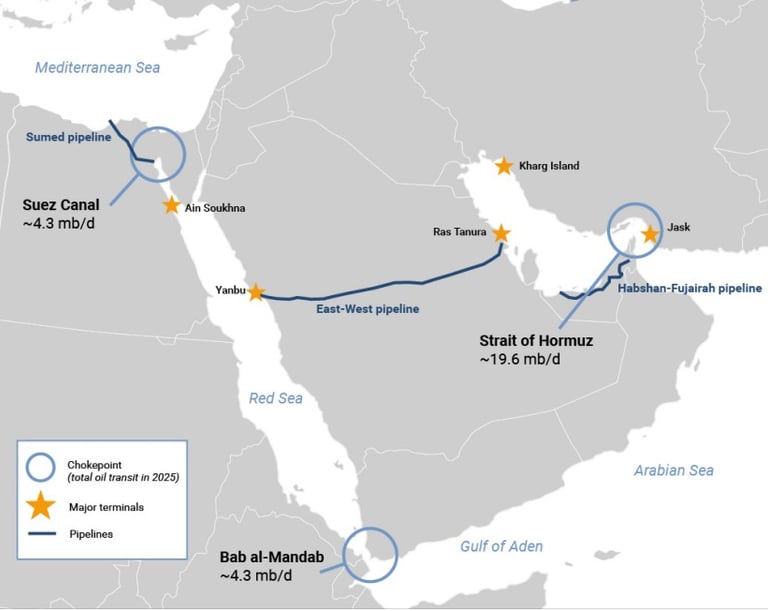
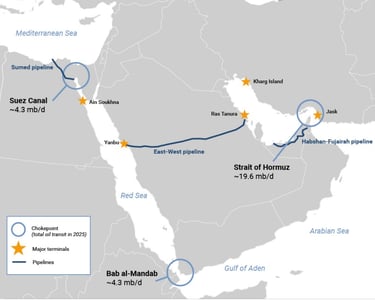
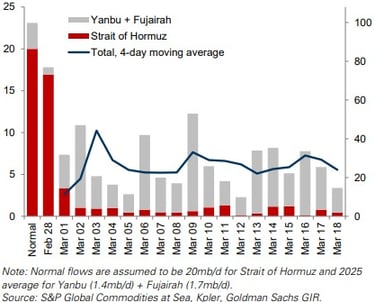
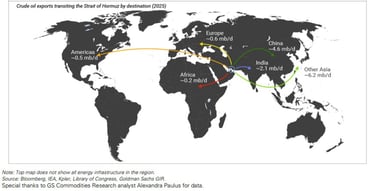
It's the oil on ships that is the flexible part of the market that we can redirect to where the oil is needed. And that is also the market where prices are formed. The seaborne market is in the order of 65 million barrels a day. So, only a subset of the 105 million. Now relative to that 65 million barrel a day, the Strait of Hormuz flows about 20 million barrels per day. So, the Strait of Hormuz is responsible for nearly a third of seaborne supply, which is, of course, very large and therefore very critical to the global energy system here is a map from a report of goldman sachs that shows us the 20mb/d that passes through the strait of Hormuz :
But how come, when we assessed the energy disruption caused by the conflict in our first and also in the following graph we took into account only 12mb/d in terms of disruption to the global energy supply ?
Well, as we see in the map above, there are 2 big pipelines that cushion the loss of the strait of Hormuz.
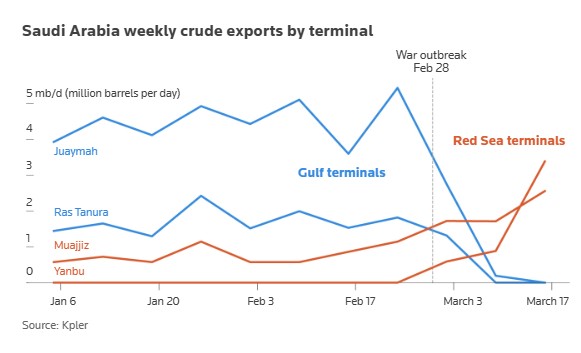
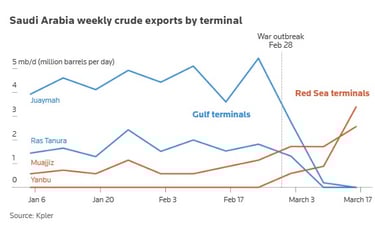
The East-West pipeline that crosses Saudi Arabia from Ras Tanura to Yanbu, giving access to the red sea. And The Habshan-Fujairah pipeline that crosses the UAE. There is of course other places that have slightly upped production to profit from the high prices but it's mainly both of those pipeline, particularly the East-West pipeline that has a max capacity of 7mb/d, that have permitted to cushion the shock :
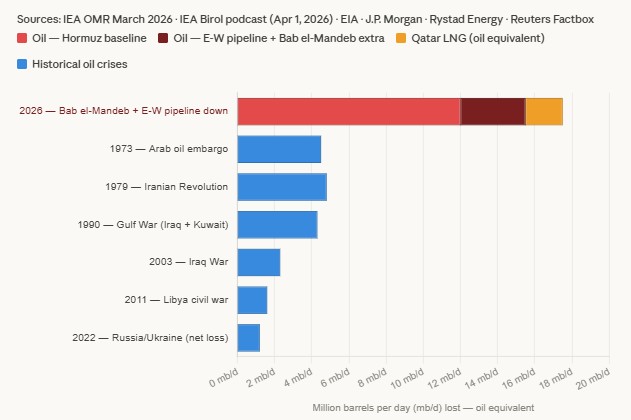
And here lies the possibility for the energy disruption to get worse, if the conflict continues and escalate. Particularly as the Houthis have entered the conflict. You can see clicking here the timeline of the conflict.
Should the houthis block the Bab al-Mandab strait and strike the East-West pipeline, as they did in the 2019 Afif attack. Where the Houthis flew seven drones in the attack on a pumping station at Afif, which is located in the greater region of Riyadh, 250 miles away from the capital.
Here is what that could look like :
But something that we haven't talked about as much is the global reserves :
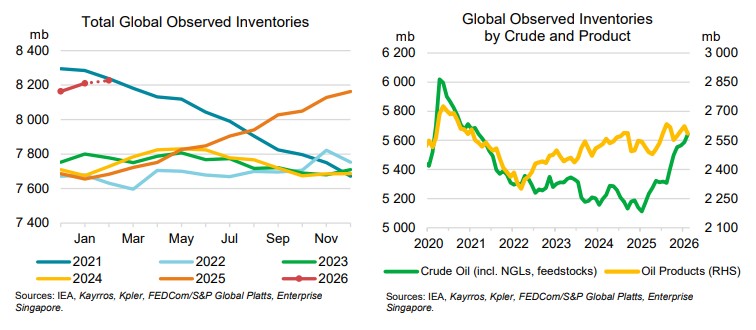
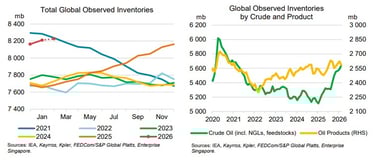
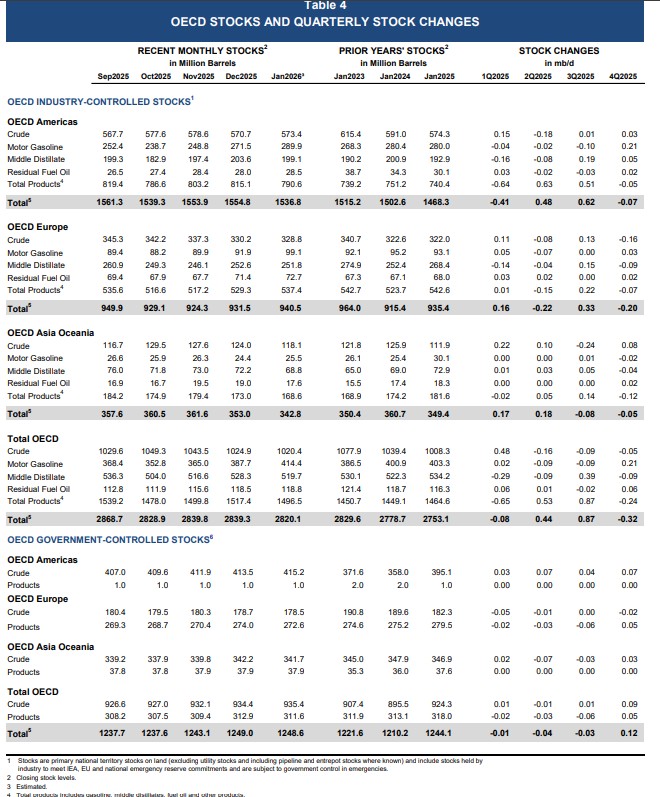
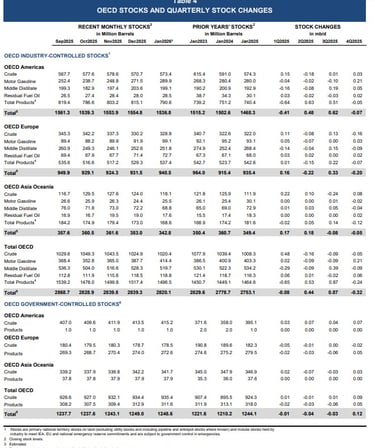
And this is what has managed to limit some of the rise in price and limit shortages despite the scale of the disruption. With for example, the IEA releasing 400 million barrels of oil, that is equivalent to around 30 days of missing supply.
IEA members hold emergency stockpiles of over 1.2 billion barrels, with a further 600 million barrels of industry stocks held under government obligation. The coordinated stock release is the sixth in the history of the IEA, which was created in 1974. Previous collective actions were taken in 1991, 2005, 2011, and twice in 2022 :
And while the strategic reserves and the oil that had already passed the strait of hormuz and were already on water before the conflict has limited the impact of the crisis. As the IEA Executive Director said : "This is only helping to reduce the pain, it will not be a cure. The cure is opening up the Strait of Hormuz. We are gaining some time, but I don't claim that this will be a solution, our stock release." If the conflict lasts 6+ months, reserves will deplete and oil prices could spike to $150-200/bbl, levels not seen in absolute terms since 2008-11.
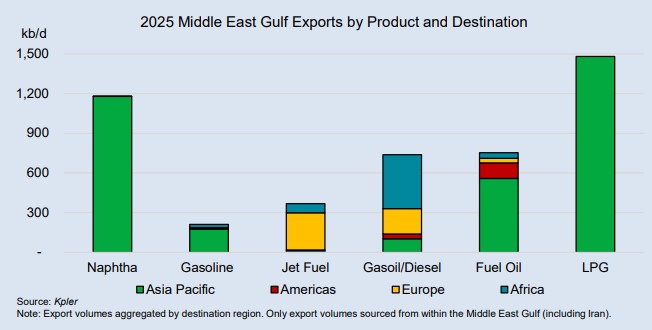
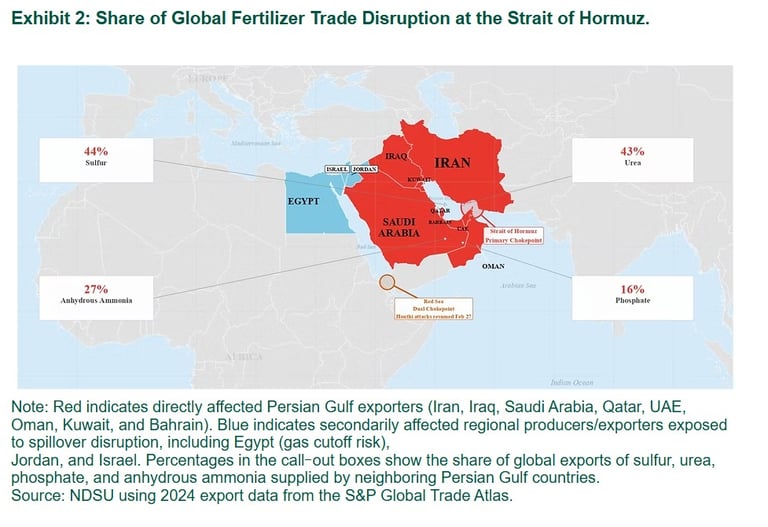
And the most affected by the conflict will be the gulf state and Asia. Although all countries will be affected as the energy market is a global market. Some countries have already put into place measure to prevent shortages and to contain the rise in prices. You can click here to see those measures by country. I have also put bellow a graph and a map that show the repartition of energy exports that go through the strait of Hormuz :


Not just an Energy shock but a commodity shock
Though we have talked a lot about oil and energy. They are not the only thing impacted by the closure of the strait of Hormuz. Here are some of the main commodities impacted by the closure of the strait :
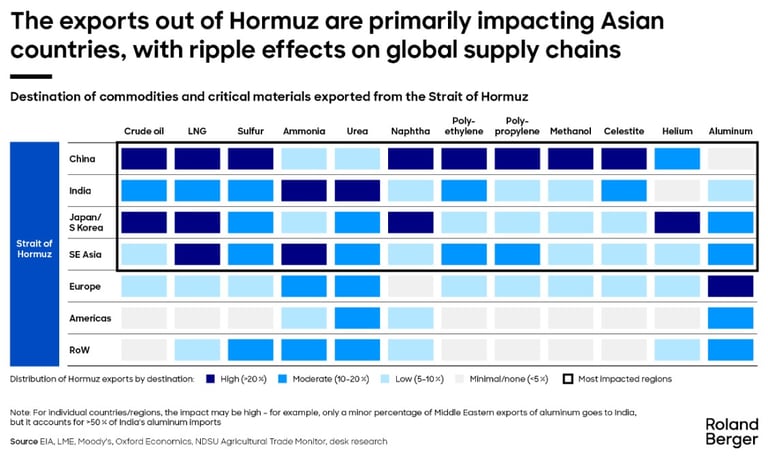

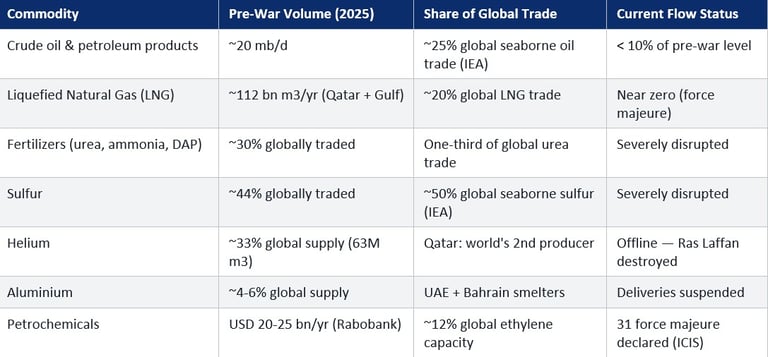
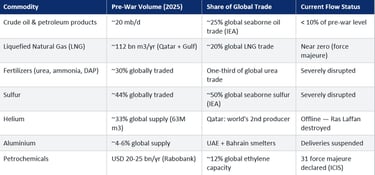
And those consequences do not stay put in the country most affected but they tend to ripple through the supply chain :
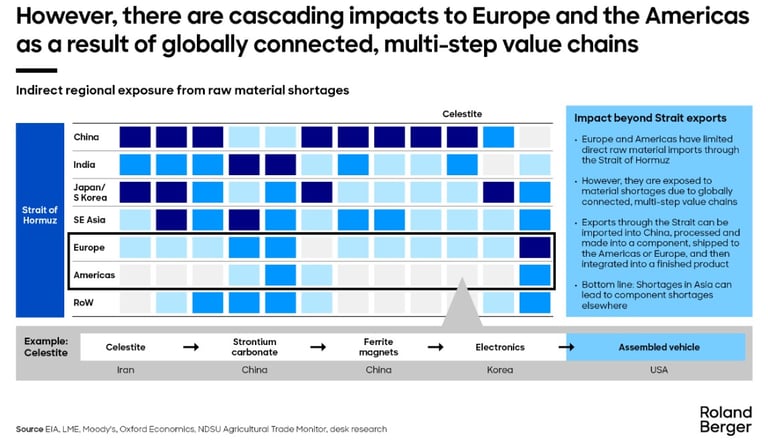
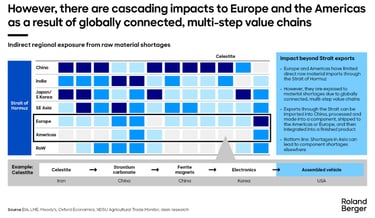
Now let's go a bit more into the detail for the main commodities impacted.
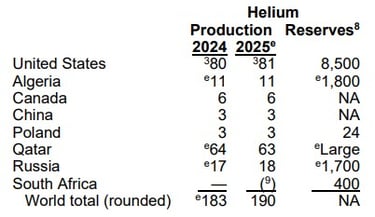
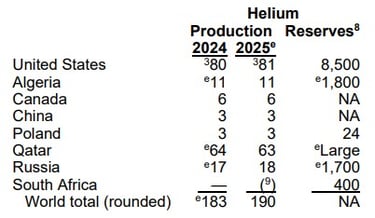
Helium — Irreplaceable Input for Semiconductors and MRI
Qatar's Ras Laffan produced helium as a byproduct of LNG processing, accounting for approximately 30–33% of global supply. QatarEnergy declared force majeure on helium contracts on March 4, 2026. There is no viable substitute for helium in semiconductor EUV lithography, MRI machine cooling, or aerospace applications.
Physical constraint: Approximately one-third of global cryogenic helium ISO containers are stranded in or around Qatar. Liquid helium evaporates within 45 days — stranded inventory is permanently unrecoverable. Repositioning equipment post-conflict requires a minimum of three months regardless of production restart. Source: Exiger (https://exiger.com/perspectives/iran-war-disrupts-one-third-of-global-helium-supply/)
Helium's role in ASML's EUV lithography machines is particularly critical: its thermal conductivity is six times higher than nitrogen, and its chemical inertness makes it the only viable cooling agent for the ultra-sensitive optics. For the 2nm semiconductor node, now in production at TSMC and Samsung, there is no engineering workaround on existing installed machine bases.
Chipmakers like TSMC or Samsung use Helium to cool wafers — the discs of silicon printed with tiny electronic circuits. Helium is used during the etching process, when material that’s been deposited on a wafer is scraped away to form transistor structures.
During the etching process, you really want to maintain a constant temperature over the wafer. And in order to do that, you need to be able to draw heat away from the wafer that’s being processed. Helium is an excellent thermal conductor. And so chip fabs will blow helium over the back of the wafer in order to speed heat removal and keep heat removal consistent.
Under current semiconductor manufacturing processes, there’s no viable replacement for helium to cool wafers.
The medical industry uses helium to cool superconducting magnets powering magnetic resonance imaging machines.
Still, a full-blown helium crisis is extremely unlikely. In the event of a shortage, the helium industry allocates supplies based on importance so critical industries such as chipmaking and medical would be at the front of the line.
And because helium is a small part of the overall production cost of a semiconductor, it’s likely that chip fabs and medical machine producers “would be willing to pay a higher price” to secure supplies.
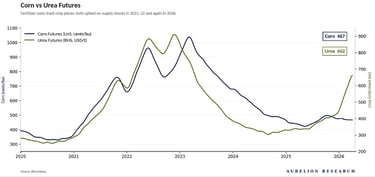
Fertilizers — How the Iran war impact food
First let's ask the simple but not necessarily obvious question, what exactly are Fertilizers ?
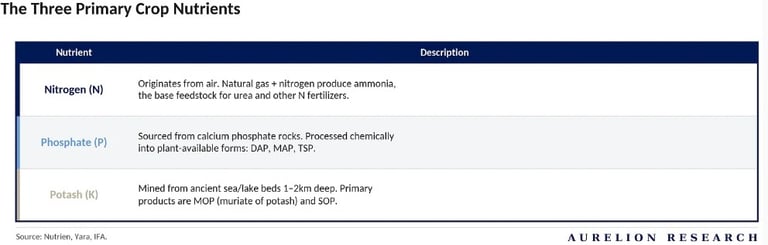
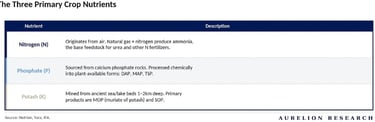
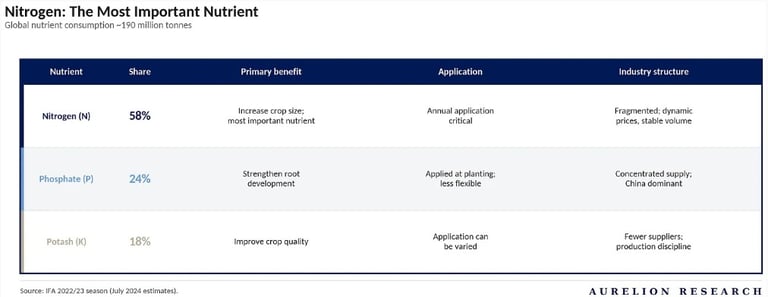
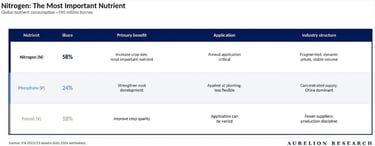
Fertilizers supply the three essential nutrients that crops need to grow:
Potassium (K) = Potash
Nitrogen (N) = Nitrogen
Phosphorus (P) = Phosphate
Each plays a distinct biological role, is produced through a different process, and has its own supply chain dynamics.
1. Potash (K)
Potash keeps plants healthy. It strengthens roots, helps retain water and makes crops more resistant to heat and disease. The product is potassium chloride (KCl), which is mined from deep underground deposits or extracted from salt lakes. About 80% of global supply comes from conventional underground mines. It is sold as either granular (preferred in the US and Brazil for blending) or standard grade (more common in Asia).
2. Nitrogen (N)
Nitrogen makes plants grow. It is the single most important nutrient for crop yield and is used in the largest volumes globally. Production begins with ammonia, made from natural gas (or coal), steam and air. Ammonia is then converted into urea, the most widely traded nitrogen fertilizer. Urea also has industrial uses in plastics, resins and emissions control. Liquid blends such as UAN are also common in agriculture.
3. Phosphate (P)
Phosphate powers the plant from the inside. It drives photosynthesis, root development and maturation. Phosphate rock is mined, then processed into phosphoric acid, the base ingredient for most fertilizer and feed products. The main end products are MAP and DAP (solid fertilizers) and liquid fertilizer. Beyond agriculture, phosphate is gaining importance as a key input for LFP batteries used in electric vehicles.
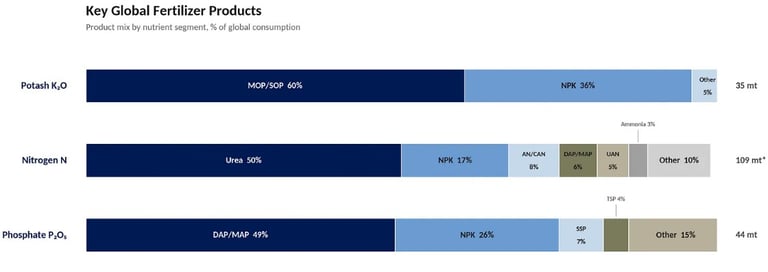
Global Fertilizer Market by Product
Nitrogen is by far the largest segment at 109M tonnes of annual consumption, and urea alone accounts for half of it. This is why the Persian Gulf disruption matters so much: the single biggest product in the single biggest nutrient segment is the one most exposed to Strait of Hormuz risk.

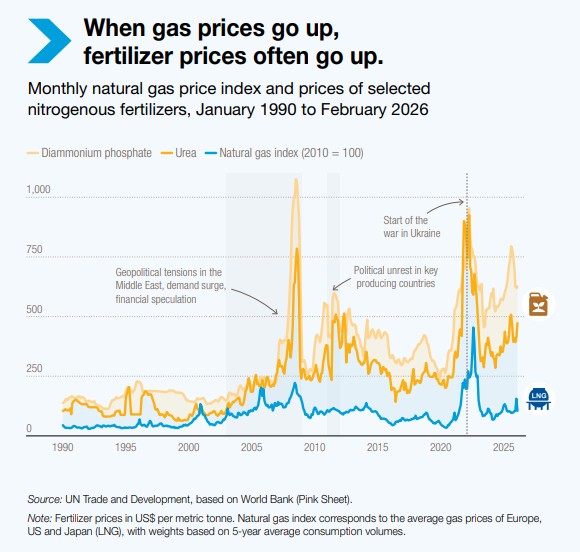
Furthermore, Understanding nitrogen economics is simple: it starts and ends with gas. The value chain runs from natural gas to ammonia to finished products (urea, nitrates, UAN). Gas is both the feedstock and the energy source, typically representing 70-80% of the cash cost of ammonia production.
This means nitrogen fertilizer prices are fundamentally a function of regional gas prices, and producers with access to cheap gas (Middle East, US, Russia) enjoy a large and persistent cost advantage over those relying on more expensive supply (Europe, India). On the revenue side, urea is the benchmark price that pulls all other nitrogen products along. Crop prices and grain inventories drive demand, while capacity additions and closures drive supply.
But how does all of this impact food ?
Because that's the real question we are asking ourselves when we hear there is issues with fertilizers because of the strait of Hormuz.
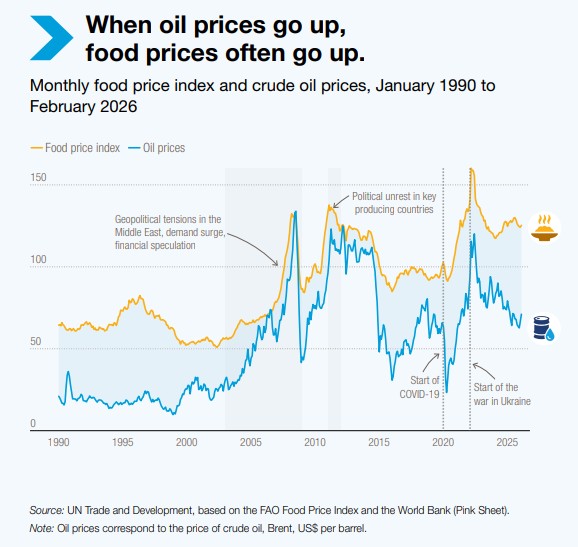
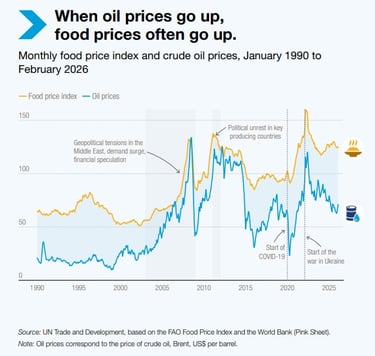
The war with Iran is affecting food systems through two mechanisms: the price of energy and the price of fertilizers
High energy prices translate to high food prices for several reasons. Energy, including motor oils and liquified gases, powers food production and processing, from tractors and irrigation systems to transportation and refrigeration. High energy costs for farmers, food transporters, and retailers are passed to consumers through high food prices. Furthermore, when fossil fuel prices rise, demand for alternative sources of energy, including biofuels, increases, and some farmers divert crops like corn, sugar, and soy to energy rather than food. Finally, as we saw before, high energy prices increase the cost of fertilizer. Liquified natural gas (LNG) is a key input to nitrogen-based fertilizers, so high LNG prices push up the prices of fertilizers like ammonia and urea, while high oil prices increase processing and transporting costs, which ultimately put upward pressure on all fertilizer prices.
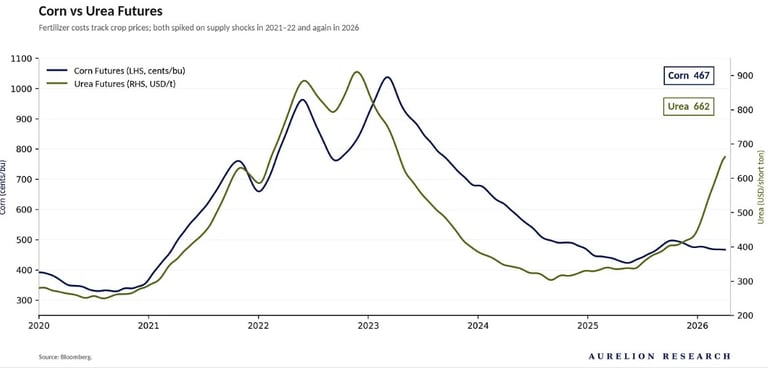
Farmers are now facing high fertilizer costs during the spring planting season, the period of peak fertilizer application. Farmers may adapt in several ways. Farmers who had purchased fertilizers before the onset of war may continue with planting as previously planned. Countries that keep national reserves of fertilizers, like China, may draw on those reserves to provide fertilizer to farmers, insulating them from high fertilizer prices. Farmers without sufficient fertilizer could be forced to purchase fertilizer at high prices or forego purchasing fertilizer altogether. This could ultimately affect crop production and alter decisions over the types of crops planted, with some farmers opting to shift from more-fertilizer-intensive crops, like corn, to less-fertilizer-intensive crops, like soybeans. Together, these decisions could change the quantity and quality of agriculture commodities on global markets, potentially increasing the cost of food for many.
The immediate impacts could materialize in the Northern Hemisphere, particularly for some farmers in major agricultural producing countries like the United States, Canada, Europe, Russia, Ukraine, China, and India. Sustained high fertilizer prices could similarly affect agricultural production during Southern Hemisphere countries’ planting season in late 2026, and even for the 2027 spring planting season in the Northern Hemisphere, depending on the duration of the war and associated high fertilizer prices. Sustained high energy prices could continue to divert grains from food to biofuels, putting upward pressure on grain prices. Grains are a principal source of animal feed, so high grain prices ultimately affect dairy and meat prices alongside prices of staple foods.
The WFP estimates that the impact of energy prices on food prices could peak approximately four months following the onset of the Iran war.
Globally, the impacts of high fertilizer and energy prices will likewise be experienced over the coming months and will be dependent on the duration and extent of the war. The FAO estimates that a one-month conflict would affect those farmers in the Southern Hemisphere who have not yet purchased fertilizers, with farmers in the Northern Hemisphere relatively unaffected. A three-month war could affect production and planting decisions for all farmers in the Northern and Southern Hemispheres. A war extending into 2027 could affect economies’ growth trajectories, affecting agricultural productivity and consumers’ purchasing power.
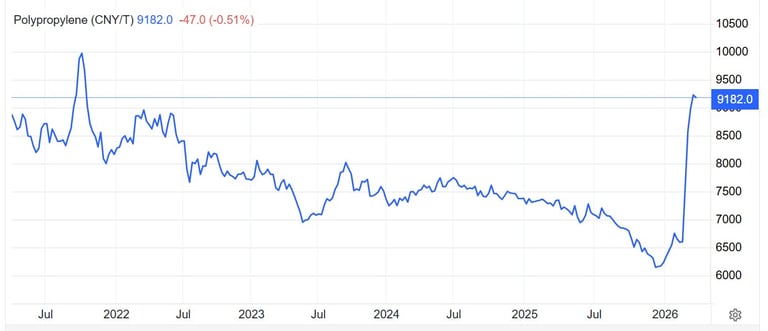
Polymer and petrochemicals — Plastic, How the Iran war impact everything
We can find plastic all around us and in nearly every element of our daily lives, from our appliances to the packaging of our foods and even in our clothes, there is plastic.
Plastic to be produced follows this chain of production :
Crude oil / natural gas → cracked into ethylene or propylene (the two core feedstocks for plastic) → polymerized into polymer resins (the raw pellets or powder form of plastic) → melted and shaped by manufacturers into finished plastic products.
Petrochemical markets are highly sensitive to disruptions in naphtha, LPG, natural gas, and energy-intensive utility costs.
When those inputs tighten, the impact can cascade quickly from crackers into ethylene, propylene, aromatics, polymers, and a wide range of intermediates and derivatives.
That matters because crackers do not need a full stop in global oil flows to feel pain. They only need enough disruption to make feedstock procurement uncertain, expensive, or logistically delayed.
A feedstock being the raw input material that enters an industrial process to be transformed into something else. It is the upstream ingredient without which the entire production chain cannot start.
That is exactly what has begun to happen in Asia, where refiners and petrochemical producers have cut runs, shut units, or declared force majeure.
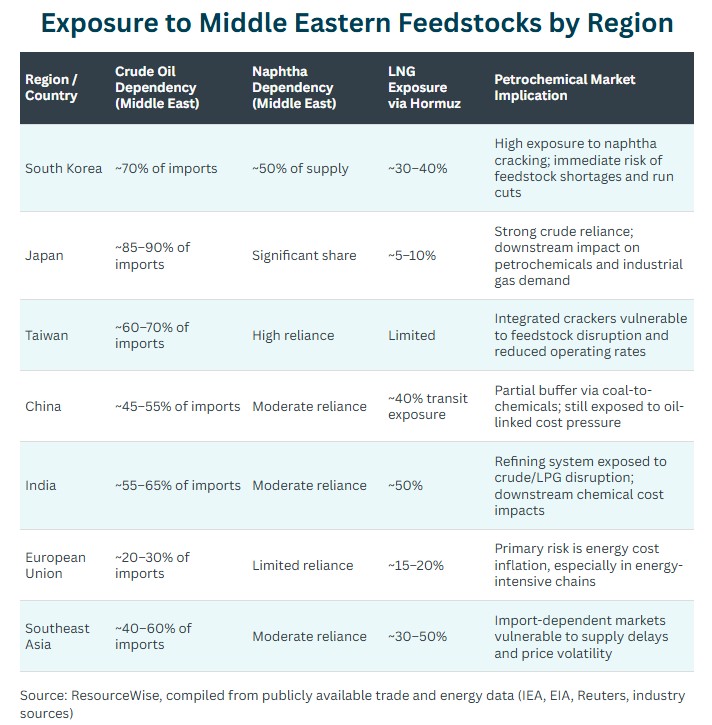
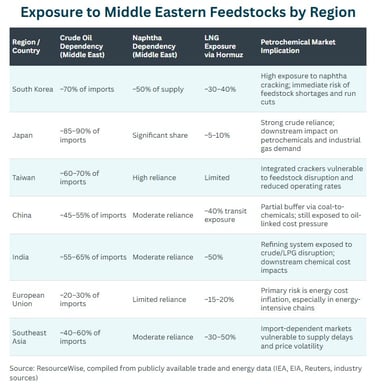
The most exposed chains are those tied closely to naphtha cracking and energy-intensive conversion. Ethylene and propylene are the first obvious pressure points because naphtha crackers are already reducing runs or shutting units in parts of Asia. From there, risk extends into polyethylene, polypropylene, styrenics, and other resin families that depend on olefin availability.
The next layer of exposure is any chain in which energy accounts for a major share of production costs. That includes chlor-alkali and PVC in Europe, where high power and gas costs can quickly change operating economics. If the conflict remains prolonged, petrochemical market participants should expect not only feedstock-driven tightness in Asia but also cost-driven volatility in Europe. European PE and polypropylene producers have gone from separately looking for a €30 to €50/tonne increase for March contracts to separately offering triple-digit increases.

The Economic Impact
Now that we have roughly understood the impact of this earthquake shaking commodities and the supply chain. What is the actual Economic Impact ?
Well this will depend on how long this will last, but here is a few things that will help you measure the Economic effect it will have, first what timeline should you expect before feeling this impact :
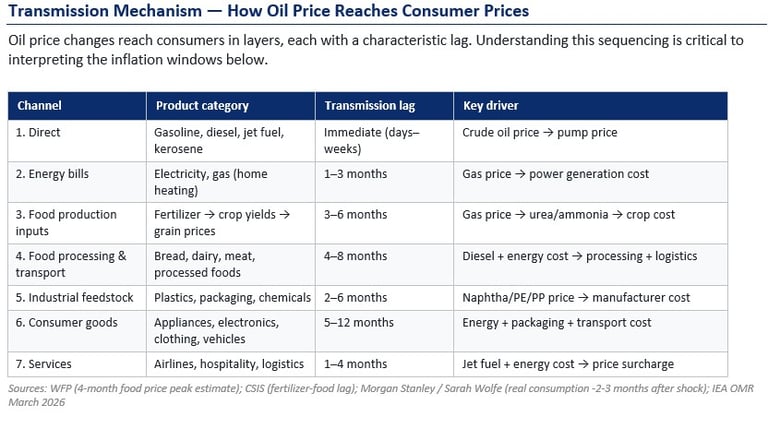
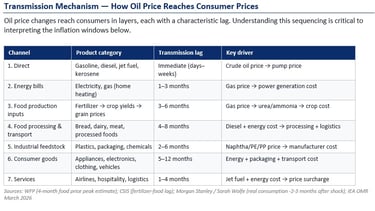
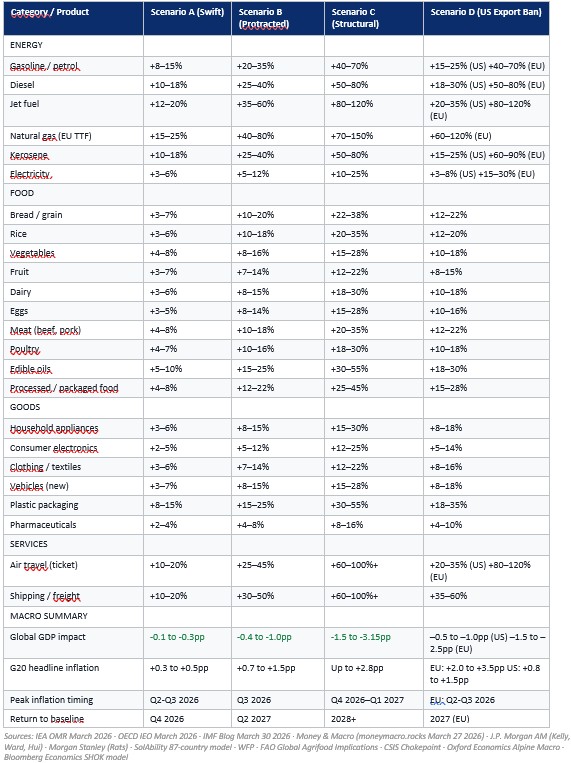
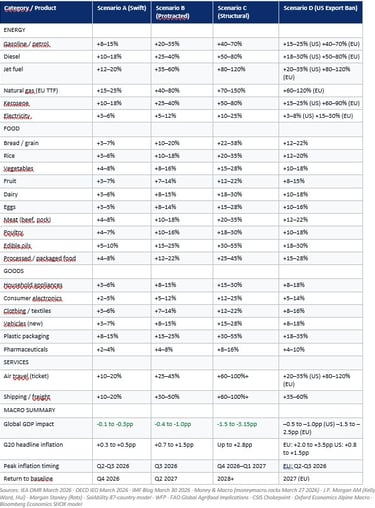
And here is an estimation of expected inflation depending on what of the following scenario play out. For now, I would say that scenario B is the most likely in terms of probability but everything is possible.
-in scenario A: Swift resolution (< 4 weeks)
-in scenario B: Protracted conflict (2-4 additional months)
-in scenario C : Structural War ( 4+ months and critical infrastructure targeting)
-in scenario D : Structural War + US Energy Nationalism (Trump Energy Export Ban)
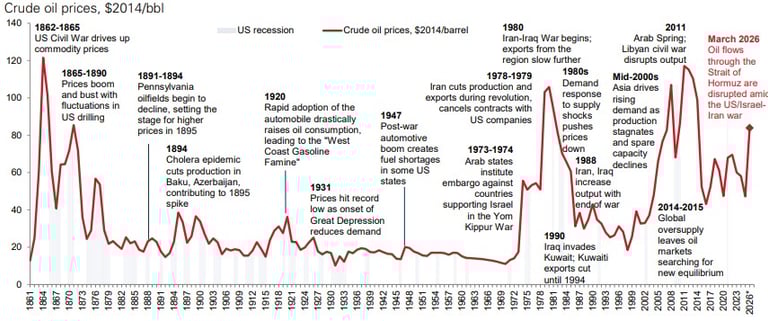
What can you do ?
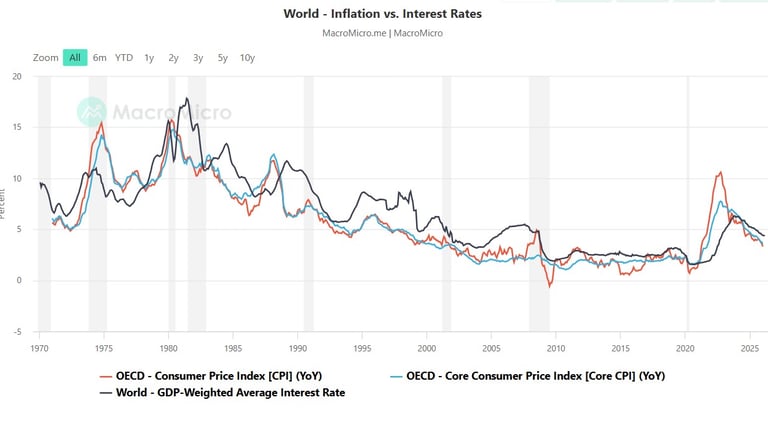
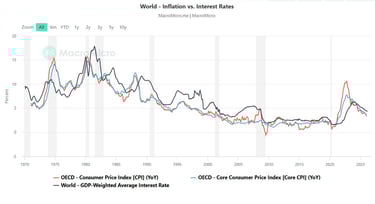
Well, first, you should expect inflation just as that was the case during the 70s :
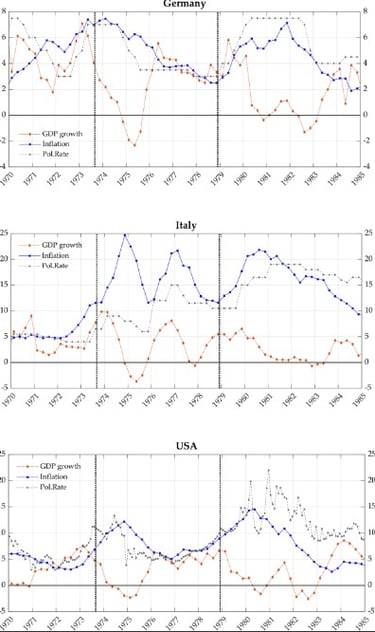
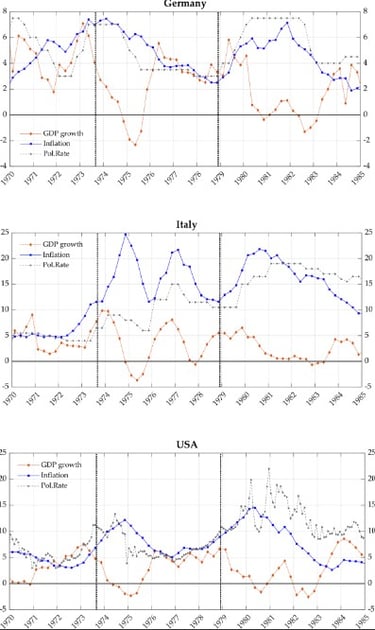
If you click here, there is a research on the link between energy shock and inflation.
With inflation, though with current governments high levels of debt it has become less likely to go as high as before, you should still expect higher interest rates :
And most important of all !
You should remember that inflation in the 70s didn't stop people from living amazing lives, the world from growing and becoming a better place.
Unless you live in proximity to the conflict where your life has really changed for the worst in an extreme way. This is in my opinion a temporary shock, it will probably hurt at least a little bit. But in the long term it will have less of an impact than you think. Structural and long-term trends will have more of an impact in the world ten years from now than this conflict. And your personal health will have a bigger impact on your life than the current Iran war.
All to say that you should prepare for some difficulties, but it isn't the end of the world.
MARKET IMPACT
Contrary to what one might intuitively expect in such a context, S&P 500 earnings projections remain, at this stage, close to their highs. In other words, the prevailing narrative (largely colored by pessimism) is not yet fully reflected in earnings expectations.
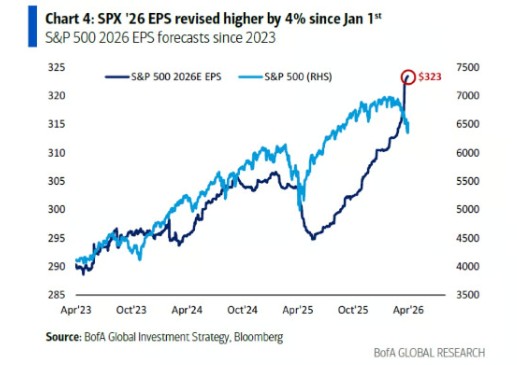
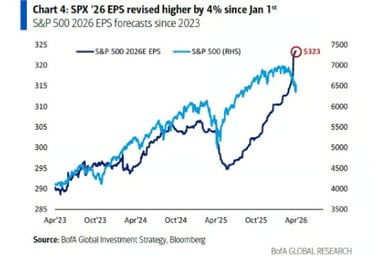
But this lag should not obscure the essential point, because behind this apparent resilience, markets are already re-rating risk, clearly distinguishing between the sectors most exposed and those managing to better absorb the shock.
The first to be hit are, unsurprisingly, the sectors heavily dependent on raw materials whose prices are soaring and whose availability is becoming uncertain. And beyond these specific cases, it is the entire global economy that finds itself weakened. In the event of a marked slowdown, or even a recession, few sectors are truly spared.
However, it should be noted that over recent months, the market consensus had been pricing in a monetary easing cycle. The U.S. Federal Reserve was expected to cut rates by 0.50 points, while the European Central Bank had only an implied market pricing of a change in interest rate of around -0.10 points.

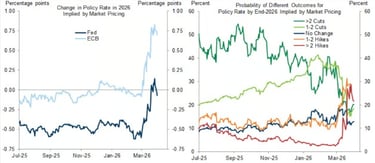
The oil shockwave has radically reversed this trend. Under the pressure of imported inflation, expectations for the ECB have surged to +0.75 points. This shift means that the market no longer anticipates any easing, but now fears three rate hikes before year-end. Across the Atlantic, the Fed is following an identical trajectory.
In a matter of weeks, the global narrative has pivoted from disinflationary optimism to the urgency of fighting inflation that is once again out of control. This regime shift has direct consequences for risk assets. When the cost of capital rises, the valuation of assets that rest on future earnings expectations, particularly growth stocks or certain asset classes such as cryptocurrencies, is automatically impacted.
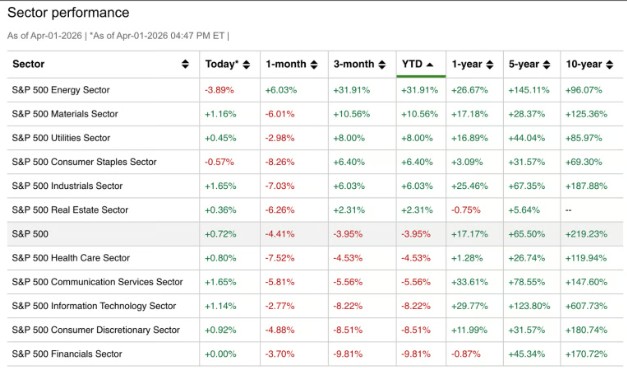
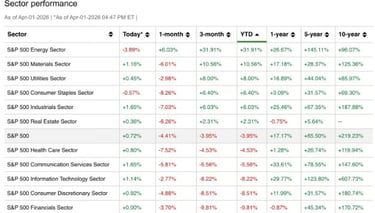
The winners of this situation, as we can see below, has been the energy sector :
Also another thing that I want to remind people. Even if the market might very well be underestimating some of the impact of the conflict in the short to mid term. Historically, though these situation have caused volatility in the markets, ultimately, and in the long term, those situation ended up being buying opportunity.
Though we cannot garantee that the past will repeat itself, we should keep those facts in mind.
If you want to see a timeline of the Iran War conflict to get a better understanding of the conflict you can click here
© 2025-2026. All rights reserved.
Centro Research
info@centroresearch.eu
Investment research of securities and markets
Reports and other shared materials should not constitute as financial advice. Investment decisions require individual due diligence and one should seek qualified counsel.