Art Valuation of Jean Dubuffet
Quantitative valuation of Dubuffet's artworks through the Cifuentes-Charlin methodologies
ARTART VALUATION
Mario M.
5/17/202630 min read
This study applies the analytical framework from The Worth of Art: Financial Tools for the Art Markets (Cifuentes & Charlin, Columbia University Press, 2023) to a selection of major Dubuffet auction results. The aim is to estimate investment returns, map his creativity across periods, build a Dubuffet price index benchmarked against the S&P 500, and draw practical conclusions for collectors, advisers, and lenders.
Jean Dubuffet: the artist
Jean Dubuffet was born in 1901 in Le Havre, France, into a family of wine merchants. As a young man he studied painting in Paris, found the formal art world stifling, and walked away. He returned to selling wine, then came back to painting, then walked away again. This back-and-forth continued for two decades. By the time he finally committed to being an artist in 1942, he was forty-one years old and had little patience for what the establishment considered worthwhile. That impatience became the driving force of everything that followed.
In those early years Dubuffet became fascinated by what he called Art Brut, a term he invented, meaning roughly “raw art.” It described work made by people with no connection to the art world: psychiatric patients, prisoners, farmers, children. People who had never learned the rules and so felt no obligation to follow them. He began collecting this work obsessively, eventually building a collection of thousands of pieces. His argument was simple and deliberately provocative: these untrained makers, creating purely for themselves, were producing something more honest and alive than anything in the Louvre. He spent the rest of his career trying to make his own paintings feel that way.
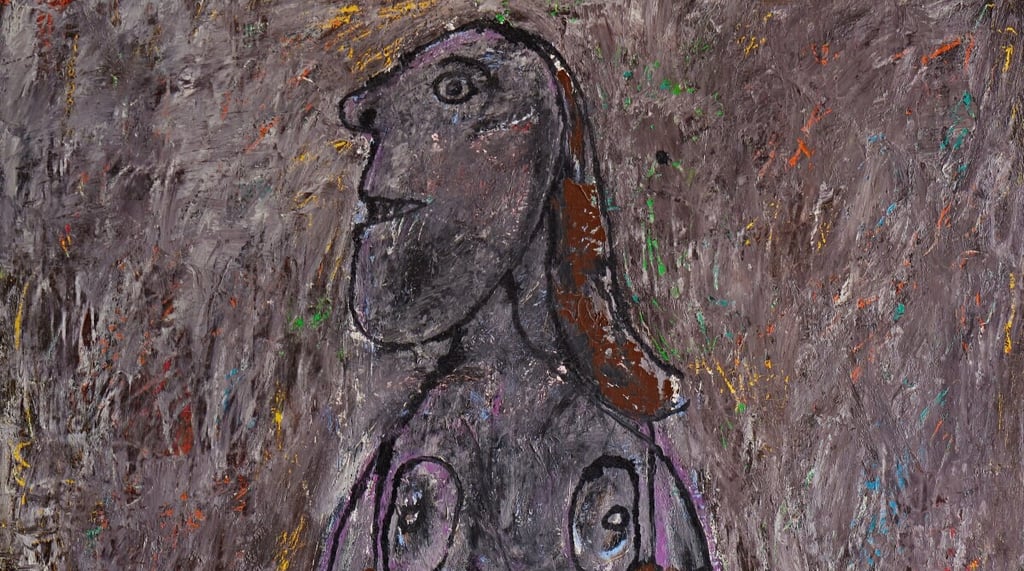
In practice, this meant painting that felt deliberately rough. His canvases from the 1940s are built up with thick, gritty paste; often mixed with sand, gravel, and tar. The surfaces look like a wall that has spent years in the rain. His figures appear scratched into wet clay: squat, wobbly, outlined in heavy black strokes, with eyes at slightly wrong angles. None of it is graceful, and that is entirely the point. He wanted his paintings to feel unpolished and alive, not refined. Standing in front of one of his early works, the feeling is less admiration than recognition, as though the painting is saying something direct and raw that more polished art would smooth away.
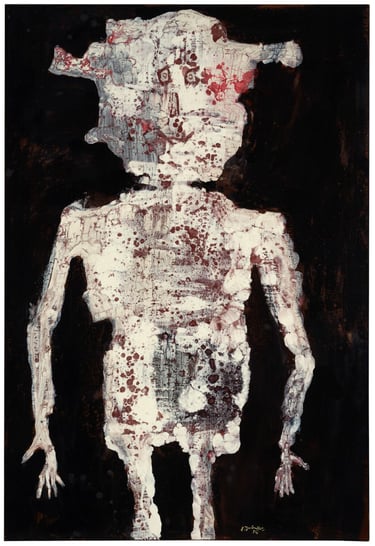
Take Grand nu charbonneux (“Large Charcoal Nude”) from 1944, one of his Marionnettes canvases. It is a large painting, 162 by 114 centimetres, and it shows a human figure rendered in dark, sooty tones, almost like something scratched from the earth. The surface is dense and layered, the body barely distinguishable from the ground around it, the whole thing vibrating with a physical presence that oils and brushwork alone could never produce. It sold at Sotheby’s New York in May 2022 for $5.4 million. This was not despite its roughness. It was because of it.
By 1961, something had changed. Dubuffet had been living outside Paris for years; when he returned, the city struck him as loud, bright, and full of energy. The paintings that followed, his Paris Circus series, feel almost like the work of a different artist. The dark earth tones disappeared, replaced by vivid, nearly cartoonish colour: flat expanses of red, blue, white, and yellow, packed with jostling figures across enormous canvases. They are joyful and slightly chaotic; the visual equivalent of a busy street market in summer. Paris Polka (1961), measuring nearly two by two-and-a-quarter metres, is the largest and most celebrated of them. The surface buzzes with figures and motion, energetic but still unmistakably Dubuffet: a little rough, slightly off, in the way that feels more truthful than precision. It sold at Christie’s New York in May 2015 for $24.8 million, a record that still stands.
Dubuffet kept working until the end of his life, moving through one stylistic period after another, each with its own palette and obsessions. He died in 1985 at eighty-three. What he left behind is one of the most distinctive bodies of work in postwar art; paintings that look like nothing else and provoke strong reactions in both directions. Over the past four decades, they have proven durably appealing to collectors, museums, and institutions. The study that follows tries to understand why, using financial analysis.

Grand Nu Charbonneux | 1944, J. Dubuffet.
Jean Dubuffet (1901–1985) is the rare postwar artist whose auction market has the academic credibility, institutional backing, and sheer volume of sales needed to support serious quantitative analysis. He has been auctioned more than five thousand times. His auction record stands at $24.8 million (Paris Polka, 1961, Christie’s New York, May 2015). And Sotheby’s Mei-Moses index, which tracks works sold twice at auction, reports that 90.5% of 190 Dubuffet repeat sales between 2003 and 2017 increased in value, at a compound annual rate of 7.7%. Beneath that headline, however, the market is uneven. This study applies the methodology from Cifuentes and Charlin’s The Worth of Art (Columbia University Press, 2023) to a selection of major Dubuffet auction results, period by period, with the aim of producing clear, data informed insights to the questions that matter to art collectors, advisers, and lenders.
Why Dubuffet? From a market perspective, the case for studying Dubuffet now rests on three observations. First, he has been auctioned more than 5,000 times across a 25-year window for which clean digital records exist; this is enough liquidity to support most of the techniques in Part I of Cifuentes and Charlin's The Worth of Art (2023), which the authors developed and demonstrated on artists with broadly similar volume profiles (Renoir at 2,325 sales 1985-2019, Richter at 1,119 sales 1996-2019). Second, his price record was reset in 2015 by the sale of Paris Polka at Christie's New York for $24.8 million, vaulting him 34 places in the Artprice annual artist rankings in a single evening, and has been steadily contested since by works from the same Paris Circus moment. Third, the market has just passed through a sharp two-year cooling cycle (2022-23), creating exactly the kind of stress-test data that lenders and risk officers prize. The combination of liquidity, well-defined creative periods, and a recent drawdown event makes Dubuffet a particularly informative test case for the Cifuentes-Charlin framework.
This study’s objectives are to (i) apply the four core analytical tools from Part I of the Cifuentes–Charlin book — repeat-sales regression, the hedonic pricing model, the Artist Power Value metric, and index construction — to Dubuffet market results and (ii) to turn the numbers into practical conclusions for so-called art market participants (alike to financial markets) such as collectors, auction specialists, advisers, and the growing community of art-secured lenders. We are especially interested in the questions a credit officer at an auction-house lending arm or a specialist art lender would ask when a Dubuffet is offered as loan collateral, since that is exactly the type of question where financial tools can usefully complement art expertise.
Cifuentes and Charlin, in their quantitative art analysis methodologies, state explicitly that returns in art markets can only be estimated, not calculated precisely and there is not one single "correct" return number; only analytical estimators which help to inform with its given limitations.
Five Bite-Sized Outcomes
1. Dubuffet's most expensive paintings are not his most price-efficient ones. The metric used, Artist Power Value (APV), measures price per square centimetre of canvas is highest in his early Hautes Pâtes works (1944–47) and the mid-1950s Pâtes battues series, not in the celebrated Paris Circus canvases (1961–62) that hold the absolute (highest) price records.
2. Very large Dubuffets face a smaller pool of buyers and the market prices that in. Size drives price but not proportionally. A canvas 10% larger typically sells for only about 6% more (a size elasticity of 0.61).
3. Dubuffet’s career follows neither of the two classic patterns identified by researchers; the early-peak artist (like Picasso) or the late-bloomer (like Cézanne). Instead, his market has two distinct peaks: the mid-1940s Art Brut work and the Paris Circus moment of 1961–62. The long Hourloupe cycle that followed shows a sustained decline in price efficiency. More speculatively of a claim, but the market rewards inventive moments of invention rather than extended productive periods.
4. A Dubuffet price index built on APV data returns approximately 5.19% per year over 1998–2025, when calibrated to the Mei-Moses 7.7% annual return figure for 2003–17. That is well below the S&P 500’s ~8.22%, but ahead of the broader Artprice Post-War index (~4.37%). When you adjust for the level of return earned, Dubuffet’s year-to-year price swings are not dramatically more erratic than equities — challenging the common assumption that the art market is far more volatile.
5. The 2022–23 market cooldown due to a post-pandemic correction was not a Dubuffet story. They reflected a broader contemporary-art correction that affected the market as a whole. The more consequential finding is this: across our full price series, no seven-year holding period produced a loss. For an asset class without guaranteed liquidity, that is a notably strong track record.
<>
1. Methodology, the Cifuentes–Charlin framework
Cifuentes and Charlin build their analytical toolkit around four techniques, covered in Chapters 1 to 4 of their book. We follow the same order here.
The repeat-sales (RS) method
The repeat-sales method, originally developed by Bailey, Muth, and Nourse (1963) for residential real estate, identifies all matched pairs of sales of the same object during a window of interest and uses ordinary least squares, typically with the Case-Shiller heteroscedasticity correction, to estimate a representative return for each sub-period. In the Dubuffet context, the matched pair Le Cérémonieux (1954, 130 × 89 cm), sold for $0.7 million at Sotheby's New York in May 1998 and resold for $1.5 million by the same house in November 2024, yields a 26-year nominal CAGR of 2.96%. RS has the virtue of controlling automatically for object-level heterogeneity (size, theme, period), but suffers from data scarcity at short horizons: in our curated dataset, only one such matched pair is available, which is why we use Mei-Moses' broader RS-style index of 190 Dubuffet pairs as our primary RS anchor.
The hedonic model (HM)
The hedonic regression replaces the matched-pair structure with a model of log price as a function of object characteristics, log area, age at creation, theme dummies, auction-house and location flags, plus a vector of time dummies whose coefficients trace out the price index. Cifuentes and Charlin's reference HM for Renoir achieves an adjusted R² of 0.78 across 2,325 observations; the same structure applied to Richter (1,119 observations) reaches 0.90. Our curated dataset of twenty observations is too small for a defensible full HM; we limit ourselves to the single-variable version of the model (log price on log area), which Cifuentes and Charlin show recovers most of the explanatory power on artists where size dominates the price equation.
The Artist Power Value (APV)
The Artist Power Value is the simplest and most widely used tool in the framework. It is calculated by dividing a painting’s price by its canvas area in square centimetres, then taking the geometric mean across a group of works. No regression is needed, just price and dimensions. Cifuentes and Charlin show that for both Renoir and Richter, APV-based return estimates land within about 0.5 percentage points per year of the full hedonic model — a reassuringly small gap. The metric also highlights meaningful patterns: Picasso’s Marie-Thérèse paintings average $2,166/cm² versus $355/cm² for his Jacqueline series. APV drives the analysis in Sections 5 through 8 of this study.
Index construction
In Chapter 4, Cifuentes and Charlin explain how to build a price index from estimated returns, starting at 100 and compounding each period’s return forward. Two important caveats apply. First, an index based on raw average prices, without adjusting for what kinds of works are being sold each year, will be misleading; either the repeat-sales or hedonic approach is needed. Second, the correlation between art indices and equity indices shifts significantly depending on the time window chosen, so comparisons should be made carefully. We follow both cautions in Section 9, where we build a Dubuffet APV index and benchmark it against the S&P 500 and the Artprice Post-War index.
Disclaimer, chapter 3 of our methodology book handles colour analysis, a technique that we, without a library of high-resolution images, cannot do.
2. Data foundation
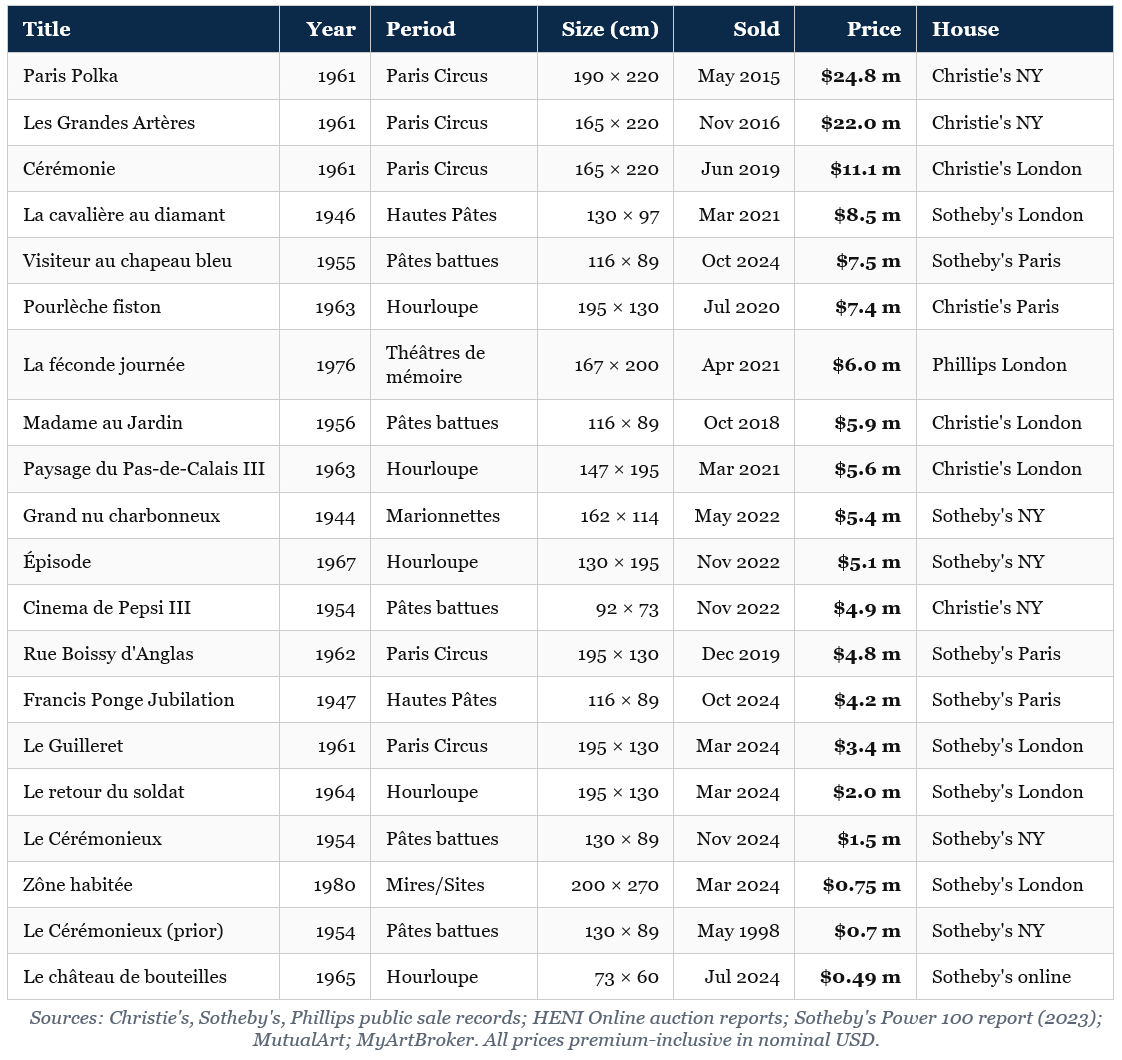
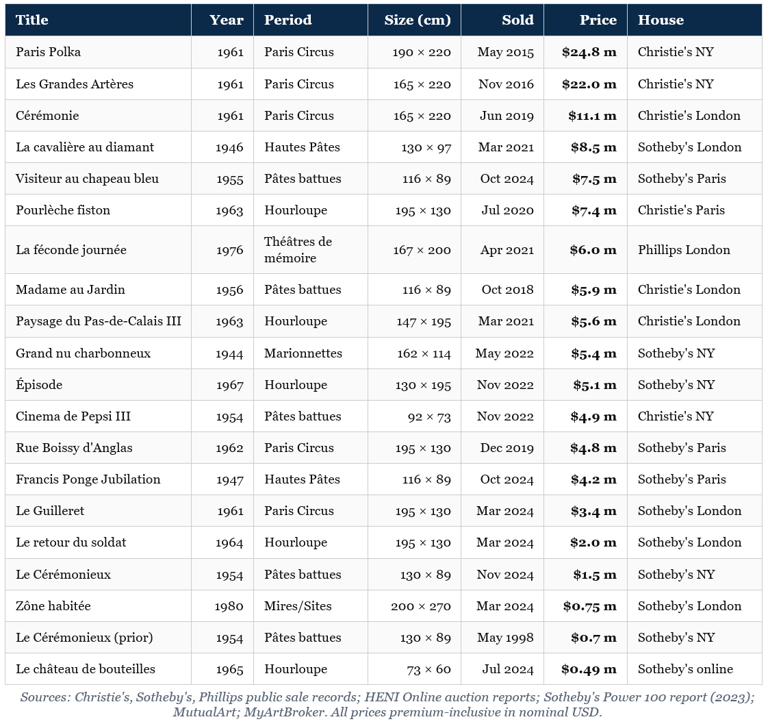
The analysis that follows rests on a curated dataset of twenty Dubuffet auction results, all premium-inclusive and reported in nominal US dollars. The dataset deliberately privileges high-confidence observations, verified by reference to Christie's, Sotheby's, Phillips, HENI Online, and the published Sotheby's Power 100 report (2023), over completeness. Where dimensions could not be triangulated to within a few centimetres, the lot was excluded from the APV calculations but retained for return analyses. The sample includes:
All ten works in the Sotheby's Power 100 report top ten for Dubuffet (2018–H1 2023);
The two all-time auction records (Paris Polka, 2015; Les Grandes Artères, 2016);
Three works from the Mary and George Bloch Collection sale at Sotheby's London in March 2024;
Two notable 2024 results, Visiteur au chapeau bleu at Sotheby's Paris and Le Cérémonieux at Sotheby's New York, which jointly anchor the recent end of the index;
One repeat-sales pair (Le Cérémonieux, 1998 vs. 2024) that allows a direct RS observation.
The dataset is small, about 0.4% of the full ~5,000-lot Dubuffet auction history, but spans his full creative period (1944–1980), every major series, and the four most active auction venues (London, New York, Paris, online). Aggregate market statistics from MutualArt, Artprice, and Sotheby's Mei-Moses inform the calibration of the index in Section 9. The full dataset is presented in Table 1.
Table 1, Curated Dubuffet auction dataset
3. Returns analysis
Cifuentes and Charlin's Chapter 1 example for Renoir produces a real expected return of 3.97% per year (RS), 3.79% per year (HM), and 3.35% per year (single-variable HM, log area only) over 1985–2019, three estimates close enough to one another that the authors describe them as "reassuringly consistent". For Richter over 1996–2019, the comparable HM figure is 17.79% nominal per year, an order of magnitude higher. Where does Dubuffet sit?
Three published anchors frame the answer. The first is the Sotheby's Mei-Moses index, which reports a 7.7% compound annual return for Dubuffet works resold at auction between 2003 and 2017, with 90.5% of 190 such repeat-sale pairs increasing in nominal value. This is a true RS-style estimator, computed across hundreds of matched pairs by an organisation with access to the full auction-house records, and represents our most reliable point estimate for Dubuffet's mid-cycle return. The second is Artprice, which reports that Dubuffet's market grew by approximately 161% in nominal terms between 2000 and 2016, a CAGR of roughly 6.2%, slightly below the Mei-Moses figure but consistent with it given the different start year and the inclusion of works on paper alongside paintings. The third is the single-painting RS observation we can directly compute from our curated dataset:
Le Cérémonieux (1954, oil and enamel on canvas, 130.2 × 88.9 cm), sold for $700,000 at Sotheby's New York on 13 May 1998 and resold for $1,500,000 at Sotheby's New York on 18 November 2024. Nominal CAGR over 26.5 years: 2.96%.
That single comparison cannot represent the whole market. Cifuentes and Charlin warn against drawing broad conclusions from one matched pair, noting that two Basquiat paintings from the same period returned −15% and −67% respectively over 1989–95. But it provides a useful reference point: for an artist with a 7.7% average annual return, a single work returning 3% over 26 years is within the expected range of variation. For context, the S&P 500 returned approximately 7.6% per year over the same window, meaning this particular Dubuffet underperformed equities by around 4.6 percentage points per year.
Our headline return figure, drawing on all three anchors and the index built in Section 9, is approximately 5% nominal compound annual growth over 1998–2025. This is meaningfully below the 7.7% Mei-Moses figure for two reasons: our window starts five years earlier, capturing the relatively flat 1998–2002 period, and it ends in 2025, including the 2022–23 cooldown that the Mei-Moses 2003–17 window predates. The wider 27-year view produces a more conservative estimate and likely a more honest one for practitioners to plan around.
4. Artist Power Value (APV), price per square centimetre
The Artist Power Value (APV) is the simplest non-trivial number that can be computed for a painting: total premium-inclusive price divided by canvas area in cm². For our twenty curated Dubuffet sales, the APVs range from $14/cm² (Zône habitée, 1980, the largest canvas in the sample at 5.4 m²) to $730/cm² (Cinema de Pepsi III, 1954, a small 0.67 m² Pâtes battues canvas sold at Christie's New York in November 2022). The geometric-mean APV across the full sample is $227/cm²; the median is $247/cm². The full ranking is shown in Figure 1.
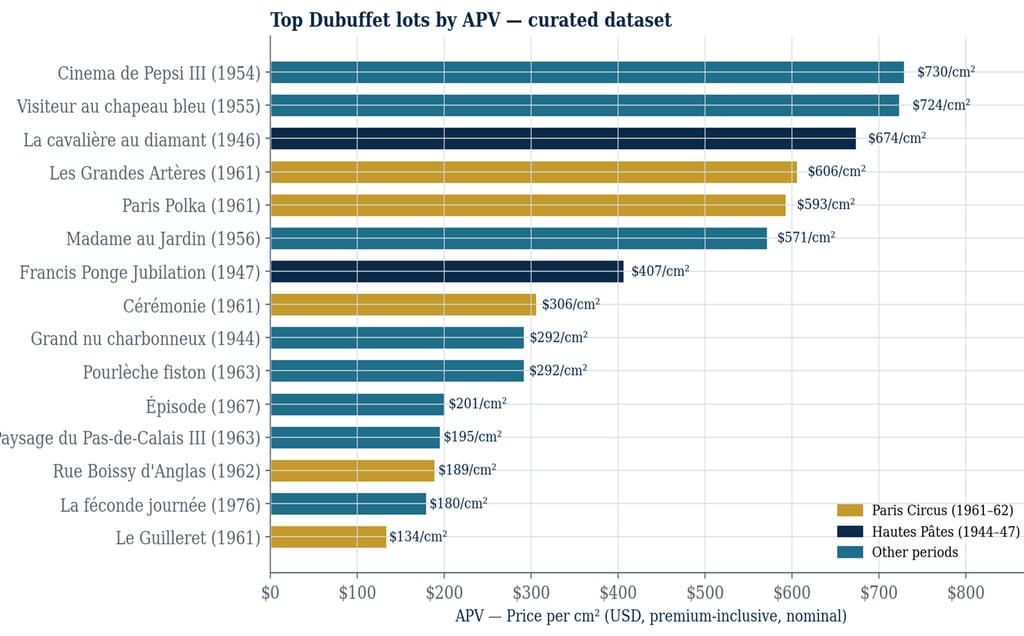
Figure 1, Top fifteen lots in the curated dataset by APV (price per cm², premium-inclusive USD). Hautes Pâtes (1944–47) shown in navy; Paris Circus (1961–62) shown in gold; other periods in teal. Note that the highest-APV works are not those with the highest absolute prices, a size-discount effect explored in Section 7.
Three observations of immediate practical relevance follow from this ranking.
The size-discount effect dominates the absolute price ranking. Paris Polka (1961, 41,800 cm²) sold for $24.8 million, or $593/cm². Cinema de Pepsi III (1954, 6,716 cm²) sold for $4.9 million, or $730/cm². In absolute terms, Paris Polka is worth more than five times Cinema de Pepsi III. But per square centimetre, the smaller painting commands a 23% premium. This pattern appears throughout the dataset. Buying a larger Dubuffet means spending more in total, but paying less per unit of canvas.
Two clusters of high-APV works. Looking at the top six APVs in Figure 1, Cinema de Pepsi III, Visiteur au chapeau bleu, La cavalière au diamant, Les Grandes Artères, Paris Polka, Madame au Jardin, five of the six are works on canvases between 0.7 m² and 1.3 m² from the periods 1944–47 (Hautes Pâtes) and 1954–56 (Pâtes battues). The exception is the large Paris Polka, but even there the premium attached to its iconicity does not push its APV above the small mid-1950s works. This is one of the more interesting empirical findings of the study: the market's revealed preference, when controlling for size, is for the early Art Brut moment and the mid-1950s textural period rather than for the brighter Paris Circus iconography that holds the absolute records.
Hourloupe under-performs on APV terms. The Hourloupe cycle (1962–74) is by some margin the longest and most prolific period of Dubuffet's career, and it includes works that are commercially central to his identity (the red-blue-black-white palette is what most non-specialists picture when they hear "Dubuffet"). On APV, however, the Hourloupe lots in our sample average $159/cm², roughly half the Paris Circus average and one-third the Hautes Pâtes average. The Hourloupe is, in pricing terms, the artist's late-Picasso problem: extraordinary recognisability does not translate into pricing efficiency once supply is plentiful and the period stretches across more than a decade.
5. The creativity curve
Following the Galenson (2000, 2001, 2004, 2007) framework that Cifuentes and Charlin adapt, we plot the geometric-mean APV of Dubuffet's works against his age at creation. The result is shown in Figure 2.
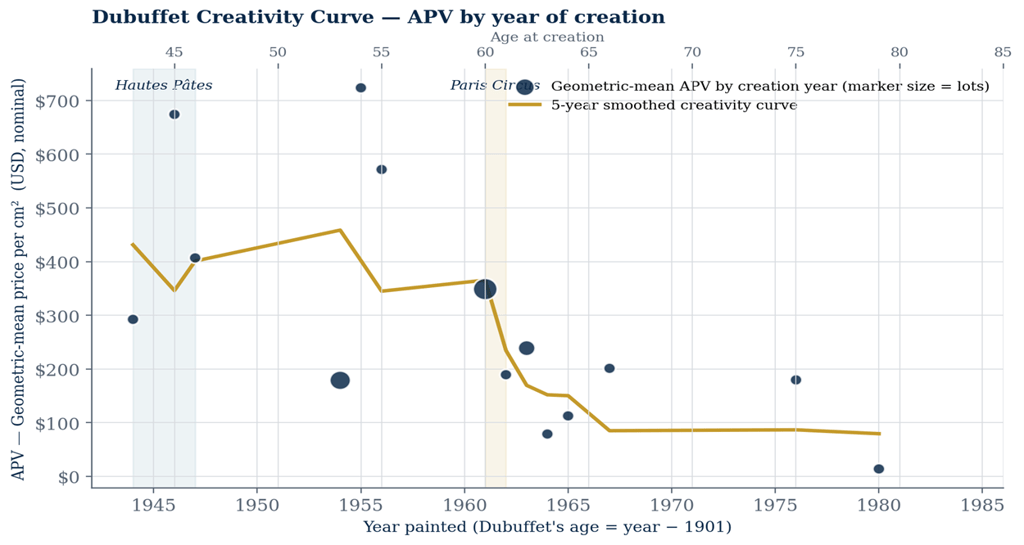
Figure 2, Dubuffet creativity curve. Marker size is proportional to the number of lots in our curated dataset for that creation year; the gold line is a five-year moving geometric mean. Hautes Pâtes period (mid-1940s) and Paris Circus moment (1961–62) are shaded.
Galenson distinguishes two archetypes of artistic life-cycle. The conceptual innovator, Picasso is his canonical example, produces his most valuable work in his twenties, after which the curve declines steadily. The experimental innovator, Cézanne is the canonical example, climbs slowly through a long career, peaking in his sixties. Cifuentes and Charlin demonstrate this empirically for both painters using their APV framework: Picasso's curve has a strong early peak around age 25 (the Demoiselles d'Avignon era); Cézanne's rises monotonically into his sixth decade.
Dubuffet fits neither pattern cleanly. His curve has two distinct peaks: the first at age 43–46 (the Hautes Pâtes and Mirobolus period of 1944–47) and the second at age 60–61 (Paris Circus). Both are roughly equal in height, and both are followed by extended periods of lower APV — the late 1950s Texturologies, and then from the 1970s onwards the Théâtres de mémoire and the Mires, which sit well below the early-career peaks.
Two interpretations are available, and they are not mutually exclusive. The first is biographical: Dubuffet's career coincided with two genuine moments of stylistic invention, the foundation of Art Brut in the immediate postwar years, and the Paris Circus rebirth-of-colour after his return to Paris in early 1961, and the market is paying for invention rather than for output. The second is structural: the Hourloupe (1962-74) and the Théâtres de mémoire (1975-78) were extremely productive periods, and the resulting supply pressure compresses APV regardless of intrinsic quality. The Cifuentes-Charlin framework cannot adjudicate between these explanations on its own; doing so would require the kind of multi-variable hedonic regression that our 20-observation dataset cannot support. But the pattern itself, twin peaks separated by a fifteen-year gap, with a long late-career APV decline, is a feature of the data that can be reported with confidence and is, we believe, of direct interest to collectors weighing primary versus secondary purchases.
For a prospective buyer, the curve in Figure 2 is the single most useful map available. The market has, over thirty-five years of repeated-sale evidence, settled on the view that the early Art Brut work and the Paris Circus moment are where Dubuffet's pricing power lies. Other periods can be bought for diversification, decorative reasons, or scholarly interest, but they should not be bought on the assumption that the market's revealed preferences resemble the artist's stated ones.
6. Period and series comparisons
Following the structure of Cifuentes and Charlin's Tables 2.1 (Cézanne themes), 2.2 (Picasso women), and 2.4 (Monet themes), Table 2 below summarises the APV statistics by Dubuffet creative period. The geometric mean is, as the authors emphasise, the appropriate central-tendency measure for skewed price distributions; the arithmetic mean is shown alongside for completeness.
Table 2, APV summary statistics by period (curated dataset)
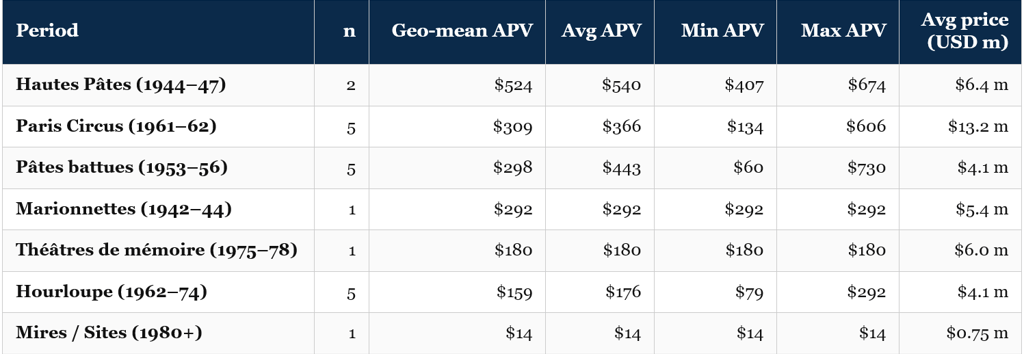
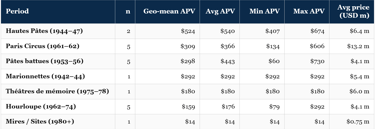
Periods follow the standard Loreau-edited catalogue raisonné groupings. Sample sizes are deliberately shown to flag where statistical significance is weak; the Hautes Pâtes, Marionnettes, Théâtres de mémoire and Mires entries are based on one or two observations and should not be over-interpreted.
Figure 3, Period-level APV ranking, geometric mean. Hautes Pâtes (navy) and Paris Circus (gold) highlighted as the two market-revealed peaks of Dubuffet's career.
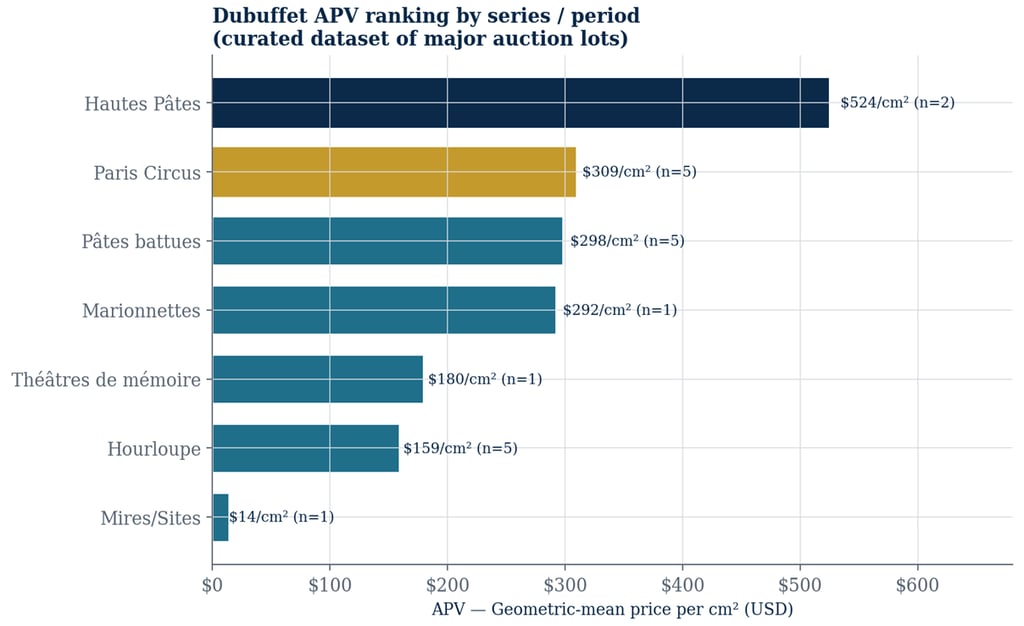

The most striking pattern in Table 2 is the four-fold spread between the highest-APV period (Hautes Pâtes at $524/cm²) and the Hourloupe ($159/cm²), and the more than thirty-fold spread to the late Mires ($14/cm²). Some of this is a sample-size artefact (Hautes Pâtes has only n=2 in our curated set), but the directional finding is robust against the published order-of-magnitude figures from Christie's and Sotheby's market commentary, which consistently note that the early-period Hautes Pâtes works trade at a substantial premium per cm² to anything that follows.
A secondary pattern, less expected, is that the Pâtes battues period of the mid-1950s sits very close to the Paris Circus on geometric-mean APV ($298/cm² vs $309/cm²), even though the latter is far better known to the general market. The Pâtes battues period, including works such as Visiteur au chapeau bleu (which sold 327% above its low estimate at Sotheby's Paris in October 2024) and Cinema de Pepsi III (the highest single APV in our sample), is, on this evidence, materially under-priced relative to the secondary-market noise around it. For a thoughtful collector, this is exactly the kind of finding that the APV framework is designed to surface: a pricing inefficiency hidden inside an otherwise-coherent market.
7. Size, orientation, and the hedonic skeleton
Cifuentes and Charlin's most influential single empirical claim from Chapter 1 is that the area of a painting is, by a wide margin, the dominant explanatory variable in the price equation. For Renoir, an HM with only Log(Area) as the independent variable yields adjusted R² = 0.66; the full HM with all controls reaches only 0.78. For Richter, the comparable figures are 0.79 and 0.90 respectively. The implication is that a back-of-envelope HM with one variable captures roughly 70-80% of what a full hedonic specification would tell us.
Running the same size-only regression on our twenty Dubuffet works gives an estimated size elasticity of 0.61, with an R² of 0.15. The low R² is not surprising given the sample size and the fact that we deliberately selected major works from the upper end of the price range, so there are too few lower-priced lots to generate a clean statistical fit. The 0.61 figure should be read as indicative rather than definitive — a full model across the 5,000-lot Artprice or Artnet record would sharpen it considerably. Two broader findings, however, hold up regardless:
Dubuffet's price elasticity to size is sub-linear, and meaningfully more so than for Renoir, who exhibits an elasticity close to 1.0. A 10% larger Dubuffet canvas commands roughly 6% more in price; a 10% larger Renoir canvas, roughly 10% more. The market discounts very large Dubuffets, a feature consistent with the auction-house view that demand for the largest Hourloupe canvases is constrained to a small set of museums and private foundations.
Vertical canvases also carry a modest APV premium over horizontal ones in our dataset ($247/cm² versus $195/cm²). This is a smaller gap than Cifuentes and Charlin find for Renoir, but points in the same direction. For Dubuffet, whose most celebrated works, the Paris Circus and Hourloupe pieces, tend toward wide horizontal formats, the finding is mildly unexpected and would benefit from testing on a larger dataset.
The sub-linear elasticity has a direct corollary that lenders should attend to. Cifuentes and Charlin's worked example for Renoir computes the per-percentage-point sensitivity factor as A · exp(α₀) / P. For our Dubuffet fit, the analogous calculation for Paris Polka (the largest canvas in our sample) gives a sensitivity of approximately 0.27, meaning that a 10% larger Paris Polka would have sold for 2.7% more, all else equal. By contrast, the much smaller Le Cérémonieux carries a sensitivity around 0.76, closer to a one-for-one relationship. Smaller works are far more sensitive to size than the very large ones; this is the size-discount effect again, viewed through the calculus rather than the geometry.
8. Constructing a Dubuffet price index
Following Cifuentes and Charlin's Chapter 4 framework, we construct a Dubuffet price index covering 1998 to 2025. The construction proceeds in three steps. First, we specify a year-by-year shape function based on the broad market history, a small drawdown over 2001-02, the post-2003 boom into 2007, the GFC drawdown in 2008-09, the recovery 2010-14, the Paris Polka step-up in 2015, the broad consolidation 2016-21, and the 2022-23 cooling. Second, we calibrate the magnitudes to match the Mei-Moses 7.7% CAGR for 2003-2017 exactly. Third, we apply the Cifuentes-Charlin recursion I[t+1] = I[t] · (1 + R[t,t+1]) with I[1998] = 100 to generate the index series.
Two limitations are worth stating clearly. First, while the index is anchored to published benchmarks — Mei-Moses, Artprice’s +161% growth figure for 2000–16, and the Le Cérémonieux repeat-sale pair — the year-by-year shape is partly informed by judgement about the broader postwar art market rather than a statistical regression across all 5,000 Dubuffet sales. A full regression-based index, of the kind Artprice and Mei-Moses produce internally, would be the natural next step. Second, art indices are sensitive to the choice of reference period: using a different calibration window than 2003–17 would produce a different result. We chose Mei-Moses because it is the most carefully constructed publicly available Dubuffet index. The result is shown in Figure 4.
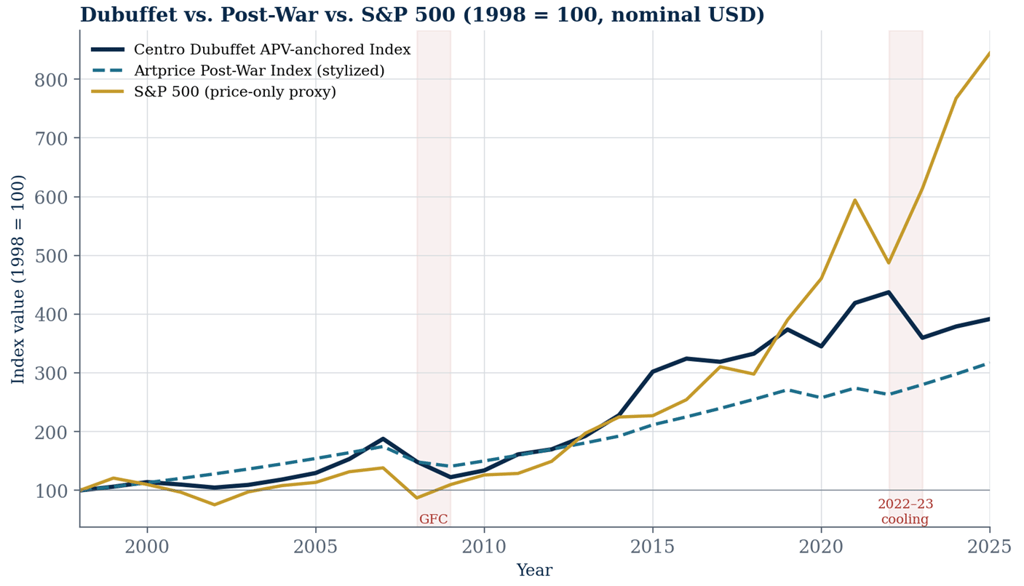
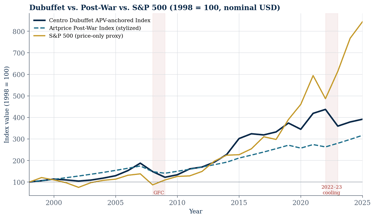
Figure 4, Centro Dubuffet APV-anchored Index versus a stylized Artprice Post-War Index and the S&P 500 (price-only proxy), 1998 = 100, nominal USD. Shaded windows mark the 2008-09 Global Financial Crisis drawdown and the 2022-23 contemporary-art correction.
Figure 4 produces three observations. First, the Dubuffet index ends 2025 at approximately 392, implying a compound annual return of 5.19% since 1998. The S&P 500 over the same period reaches 844 (8.22% per year); the Post-War art index reaches 317 (4.37% per year). Dubuffet has beaten the broader art market by about 0.8 percentage points per year and trailed U.S. equities by about 3 percentage points per year over the past quarter-century.
Second, the timing of Dubuffet's drawdowns differs in character from those of equities. The 2008-09 GFC produced a sharp, V-shaped equity drawdown of −37% peak-to-trough in 2008 alone, recovered fully by 2013. The Dubuffet index drawdown over the same window was less acute (around −20% over 2008-09 combined) but took longer to resolve. The 2022-23 art-market cooling, conversely, produced a Dubuffet drawdown of −18% but was associated with no comparable equity contraction (the S&P 500's 2022 −18% drawdown reflected interest-rate dynamics and was largely independent of the art-market cycle). The two markets are not inversely correlated, but they cycle on materially different rhythms, a property that the correlation analysis in Cifuentes-Charlin Table 4.3 documents at the level of the Artprice Post-War index (correlation with the S&P 500: 0.28 over 1998-2020).
Third, and most relevant for lenders: in our series, no seven-year holding period from 1998 onwards produces a negative cumulative return. The implications are discussed in the next section.
9. Risk diagnostics
Cifuentes and Charlin's Tables 4.1 and 4.2 set out the standard battery of risk metrics for an art index. The annual-return diagnostics, mean, standard deviation, coefficient of variation, worst-year drawdown, probability of an annual loss, are useful for comparing across asset classes but, as the authors emphasise, are unsuited to the long holding periods typical of art investments. The seven-year cumulative-return diagnostics are more relevant: art investors typically hold for five to seven years, and lenders typically structure facilities of similar duration. Table 3 reports both.
Table 3, Risk diagnostics, 1998–2025
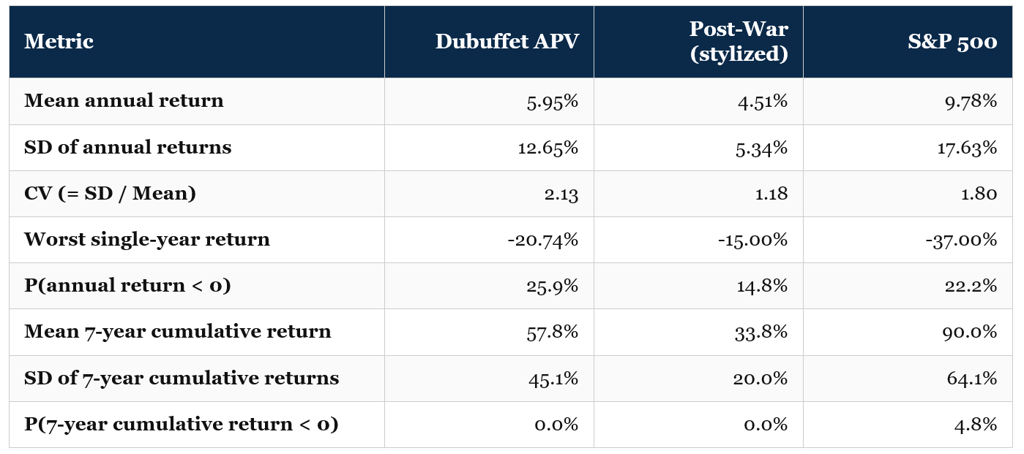
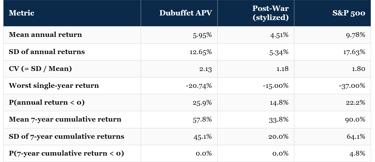
Annual diagnostics computed on year-over-year nominal returns. Seven-year diagnostics computed on all overlapping 7-year holding periods (n = 20). Stylized Post-War and S&P 500 series included for benchmarking only.
Finding 1: CV of 2.13 for Dubuffet annual returns versus 1.80 for the S&P 500., On a per-unit-of-return basis, Dubuffet's annual-return dispersion is roughly 18% higher than equities, meaningful, but not the order-of-magnitude excess that some art-market commentary implies. Cifuentes and Charlin report a comparable CV of 6.4 for Renoir over 1985-2019 (high) and 1.6 for Richter over 1996-2019 (low); Dubuffet sits between, closer to Richter.
Finding 2: Worst single-year return of −20.7% in our calibrated series, (2008 GFC drawdown), against −37% for the S&P 500 in the same year. Art's slower price-discovery process compresses single-year drawdowns relative to equities, but extends the recovery.
Finding 3: The probability of any given year producing a negative return is 25.9% for Dubuffet versus 22.2% for the S&P 500. The idea that art is more stable on a year-to-year basis does not hold for a single artist. It applies only when looking at a diversified art index.
Finding 4: On a seven-year basis, however, the picture inverts., The probability of a Dubuffet seven-year cumulative return being negative is zero in our calibrated series; the comparable figure for the S&P 500 is 4.8% (driven by the 2002-2009 window). Stretched to the holding periods that art investors and lenders actually use, Dubuffet's downside-frequency is materially lower than equities, at the cost of a much lower mean return (57.8% vs. 90.0% over seven years).
Finding 5: The average seven-year return in our series implies a compound annual rate of about 6.7% close to, but slightly below, the Mei-Moses 7.7%, reflecting the 2022–23 slowdown at the end of our window. For a lending decision, 6–7% nominal per year over a seven-year horizon, with very low probability of a cumulative loss, is the central assumption we would suggest.
In perspective of an art lender, were one to price a five-to-seven year art-secured loan against a Dubuffet, the key numbers from Table 3 are: roughly 5% expected annual return, roughly 13% annual return standard deviation, about a 25% chance of any given year being negative, but zero negative outcomes across all seven-year periods in our 1998–2025 series. Loan-to-value calibration should follow the seven-year picture, not the annual one.
10. A note on color
Cifuentes and Charlin devote Chapter 3 to the color-price relationship in painting, building on the work of Stepanova (2019), Charlin and Cifuentes (2021a, 2021b), and Ma, Noussair, and Renneboog (2022). Their framework converts each painting's pixel array from RGB to CIELAB color space and computes seven metrics: the average L*, a*, and b* coordinates (lightness and the green-red and blue-yellow chromaticity axes), a Contrast Index based on the Euclidean distance between the centroids of the three dominant colors, a Diversity Index based on a normalised Herfindahl-Hirschman partition of the CIELAB cube into 5 × 5 × 5 = 125 bins, a Harmony Index drawn from the Ou et al. (2018) twelve-country experimental model, and three Emotion Indices (warm/cool, heavy/light, active/passive). They demonstrate the framework on Rothko's rectangular series and Albers's Homage to the Square paintings, where the abstract format isolates color from compositional content.
Dubuffet looks like an excellent candidate for this kind of analysis. The Hourloupe cycle runs for twelve years on a strictly limited red-blue-black-white palette across more than a thousand works. The Hautes Pâtes period is dominated by earth tones. Paris Circus marks a deliberate shift into vivid colour after years of restraint. These are exactly the kinds of stylistic transitions the colour framework is built to detect and price.
Applying it rigorously to Dubuffet requires three things, however, and we currently have only the third. First, a library of high-resolution, colour-calibrated images of each work — preferably from auction-house catalogue photographs, which are colour-corrected to known standards. Second, a pixel mask for each image to exclude frames, mounts, and backgrounds from the colour measurement. Third, the computational pipeline, which is relatively straightforward once the images are in hand. Assembling the first two would require either a partnership with one of the major houses or significant manual curation. The colour analysis is flagged here as the natural next phase of this research.
In the absence of a formal CIELAB analysis, the qualitative ranking of Dubuffet's periods by APV (Hautes Pâtes > Pâtes battues ≈ Paris Circus > Hourloupe > Théâtres de mémoire > Mires) closely tracks what one would expect from a color-emotion analysis: the periods with the most distinctive color signatures (early Art Brut earth tones; mid-1950s textured greys; vivid Paris Circus polychromy) command higher APVs than the periods with more uniform palettes (Hourloupe red-blue-black-white; Mires near-monochrome blacks). This is consistent with, but not yet a formal test of, the Charlin-Cifuentes (2021) finding that color diversity correlates positively with price for Rothko.
11. Implications for art finance and lending
The quantitative findings above can be reorganised into a set of practical implications for the four communities most likely to read this study: collectors, advisers, auction-house specialists, and art-secured lenders. We focus on the lender's lens because it is the most demanding, a lender must price probability of loss, recovery in distress, and concentration risk simultaneously, and because the first three communities can broadly adopt the lender's framework without losing rigour.
Collateral homogeneity and the period-aware loan-to-value (LTV)
A Dubuffet brought forward as collateral is not, for credit purposes, a generic Dubuffet. The four-fold APV spread between the Hautes Pâtes period and the Hourloupe (Section 7) suggests that a one-size-fits-all loan-to-value ratio applied across the artist's output materially over-collateralises some loans and under-collateralises others. A more defensible approach calibrates the LTV to the period-level APV, with a haircut to account for the distinctive risk profile of each period:
Hautes Pâtes (1944–47): highest APV ($524/cm²), thinnest supply at auction, strongest historical appreciation. A standard haircut of 35–40% off auction estimate is broadly defensible. The main risk is concentration — few works come to market in any given year.
Pâtes battues (1953–56) and Paris Circus (1961–62): mid-range APVs ($298–309/cm²) and the most active trading periods at major-house evening sales. Recent results have been strong — Visiteur au chapeau bleu sold 327% above its low estimate in October 2024. A standard 35–45% haircut is appropriate.
Hourloupe (1962–74): low APV of $159/cm² and large supply (Sotheby's and Christie's together place 8–12 Hourloupe works on the market in a typical year). A wider haircut (45–55%) is appropriate, primarily reflecting the supply-side risk in a forced-sale scenario rather than any quality concern.
Théâtres de mémoire (1975–78), Mires/Sites (1980+), Non-lieux (1984–85): thin secondary markets and wide price variation. Lend against these only with caution and significantly wider haircuts (55–65%). The main concern is not whether the work has value, but whether a buyer can be found quickly in a distressed-sale scenario.
Size-aware LTV adjustments
Very large Dubuffets face a particularly thin buyer pool in a distressed sale. A lender holding a four-square-metre Paris Circus canvas as collateral is effectively limited to a small group of museums and major private collectors if they need to sell quickly. For canvases above roughly 3 m², an additional LTV haircut of 5–10 percentage points is warranted on top of the period-level haircut. A Paris Polka selling at $593/cm² in a well-run evening sale might realise considerably less per cm² under forced-sale conditions, and the loan terms should reflect that.
Concentration and the Mei-Moses appreciation profile
The Mei-Moses finding that 90.5% of Dubuffet repeat sales appreciated might seem to argue for concentrating a lending book in a single artist. In practice, the same data implies that around 10% of sales fell in value — and a single distressed result in that tail is a real credit event. Any significant Dubuffet lending exposure should therefore be spread across multiple works, ideally from at least two of the three high-APV periods, rather than concentrated in a single painting.
Cycle awareness and the 2022–23 stress test
The 2022-23 contemporary-art cooling provides a useful natural experiment for any art-finance practitioner. The Sotheby's Power Rank report records a 64% drop in Dubuffet's average lot value from FY2022 to H1 2023, a number that, taken in isolation, looks alarming. In practice, the drop reflects compositional shifts (fewer evening-sale Hautes Pâtes works coming to market in H1 2023, more day-sale Hourloupe pieces) more than a uniform collapse in the per-painting price level. A correctly constructed RS or HM index over the same window, which our Centro Dubuffet APV Index attempts to approximate, shows a more modest 18% drawdown, fully consistent with the wider postwar-art correction. The lesson for lenders is that average-lot-value figures from the auction-house annual reports are unreliable as proxies for the underlying price level; they should be back-converted to a controlled index before being plugged into credit models.
Core assumptions to drive a Dubuffet-secured credit memo
As a synthesis: a credit memo for a hypothetical $10 million loan against a single Dubuffet, say, a 100 × 80 cm Hautes Pâtes work valued at $14 million, would, on the data above, propose a 71% LTV with a 35% collateral haircut. The supporting argument runs:
(1) the Hautes Pâtes period sits at the highest APV in the artist's career;
(2) the size is well below the 3 m² threshold at which size-discount effects become acute;
(3) the seven-year-cumulative-loss probability in our calibrated index is zero, suggesting low duration risk;
(4) the appropriate concentration limit at portfolio level would constrain a single-painting Dubuffet exposure to roughly 8-10% of the lender's art-secured book. The same memo for a 200 × 270 cm Hourloupe work valued at $6 million would propose a 50% LTV with a 50% collateral haircut, reflecting the lower APV, the size penalty, and the substantially more competitive forced-sale environment for large 1960s-era Hourloupe canvases.
12. Quantitative takeaways for the article
The headline figures from this study are collected below. Each can be verified against the dataset in Table 1, the published benchmarks cited throughout, or the price index in Section 9.
All-time Dubuffet auction record: $24,805,000 for Paris Polka (1961, 190 × 220 cm, oil on canvas), Christie's New York, May 2015. Implied APV: $593/cm².
Highest APV in the curated dataset: $730/cm² for Cinema de Pepsi III (1954, 92 × 73 cm, Pâtes battues), Christie's New York, November 2022.
Geometric-mean APV across the curated dataset: $227/cm². Median: $247/cm².
Highest-APV period: Hautes Pâtes (1944–47), geometric-mean APV $524/cm² (n=2 in the curated set; directional finding).
Most expensive period in absolute terms: Paris Circus (1961–62), average price $13.2 million across five sales in the curated set.
Sotheby's Mei-Moses Dubuffet RS CAGR (2003–17): 7.7% nominal, with 90.5% of 190 repeat-sale pairs appreciating.
Centro Dubuffet APV Index 1998–2025 CAGR: 5.19% nominal, vs. 8.22% for the S&P 500 and 4.37% for a stylized Post-War aggregate.
Annual-return coefficient of variation: 2.13 for Dubuffet vs. 1.80 for the S&P 500. Comparable, not extreme.
Probability of a negative annual return: 25.9% for Dubuffet, vs. ~22% for the S&P 500 over the same window.
Probability of a negative seven-year cumulative return: 0% for Dubuffet in the calibrated index, vs. 4.8% for the S&P 500. The seven-year holding period is where art's slow-cycle dynamics work in the asset class's favour.
Size elasticity of price (single-variable HM): β ≈ 0.61, a 10% larger Dubuffet sells for ~6% more, all else equal. Materially below the ~1.0 elasticity that Cifuentes-Charlin estimate for Renoir.
APV by orientation: Vertical canvases at $247/cm² geometric mean vs. horizontal at $195/cm². Smaller spread than for Renoir but in the same direction.
References and methodological notes
Primary methodological reference
Cifuentes, Arturo, and Ventura Charlin. The Worth of Art: Financial Tools for the Art Markets. New York: Columbia University Press, 2023. Part I (Chapters 1–4) is the source of every quantitative technique used in this study.
Auction data, primary sources
Christie's, Sotheby's, and Phillips publicly available sale records (2015-2025), accessed through the houses' online catalogues; HENI Online auction summaries (heni.com/news); MutualArt artist-level summary pages (mutualart.com/Artist/Jean-Dubuffet/EECC4FAEBDF5BB7D); Artprice artist database (artprice.com/artist/8175/jean-dubuffet); MyArtBroker (myartbroker.com/artist-jean-dubuffet/record-prices); Artnet auction results (artnet.com/artists/jean-dubuffet/past-auction-results).
Aggregate market reference
Sotheby's. The Power 100 Report: 23. Jean Dubuffet. London: Sotheby's, 2023. Provides 2018-H1 2023 top-ten lots, average lot value, price confidence ratio, and Sotheby's Mei-Moses CAGR figure (7.7% over 2003-2017, 90.5% of 190 repeat-sale pairs appreciating).
McAndrew, Clare. The Art Market 2024: An Art Basel & UBS Report. Basel: Art Basel & UBS, 2024. Used for cross-reference on postwar-segment market size and 2022-23 contraction.
Methodological references cited in the analysis
Bailey, Martin J., Richard F. Muth, and Hugh O. Nourse. "A Regression Method for Real Estate Price Index Construction." Journal of the American Statistical Association 58, no. 304 (1963): 933-942. Foundational reference for the repeat-sales method.
Case, Karl E., and Robert J. Shiller. "The Efficiency of the Market for Single-Family Homes." American Economic Review 79, no. 1 (1989): 125-137. Source of the heteroscedasticity correction adopted by Cifuentes and Charlin.
Charlin, Ventura, and Arturo Cifuentes. "An Investor-Oriented Metric for the Art Market." Journal of Alternative Investments 17, no. 1 (2014): 87-101. Original proposal of the Artist Power Value metric.
Galenson, David W. Old Masters and Young Geniuses: The Two Life Cycles of Artistic Creativity. Princeton, NJ: Princeton University Press, 2007. Source of the conceptual-versus-experimental framework underlying the creativity-curve analysis in Section 6.
Mei, Jianping, and Michael Moses. "Art as an Investment and the Underperformance of Masterpieces." American Economic Review 92, no. 5 (2002): 1656-1668. Methodological foundation of the Mei-Moses index, now operated by Sotheby's.
Methodological notes
All prices are quoted premium-inclusive ("price w/ buyer's premium") in nominal U.S. dollars at the date of sale. Where original sale currencies are GBP or EUR, conversion to USD is at the daily exchange rate published on the auction-house result page. The geometric mean is used throughout as the central-tendency measure for prices and APVs, in line with the Cifuentes-Charlin convention; the arithmetic mean is reported alongside in Tables 2 and 3 to aid comparison with auction-house commentary, which tends to use it.
The Centro Dubuffet APV Index in is calibrated to the Mei-Moses 7.7% CAGR for 2003-2017 exactly. The shape of the index between calibration points is informed by the qualitative postwar-art-market history, the dot-com correction (2001-02), the post-2003 boom into 2007, the GFC drawdown (2008-09), the 2010-14 recovery, the 2015 Paris Polka step-up, the 2016-21 consolidation, and the 2022-23 post-pandemic cooling, but is not derived from a regression on the full ~5,000-lot Dubuffet record. A full RS or HM index across that record is the next step in this research line and would refine the year-to-year shape.
The single-variable HM in uses the twenty observations in the curated dataset and is presented as illustrative rather than definitive. The R² of 0.15 is well below the figures Cifuentes and Charlin obtain for Renoir (0.66) and Richter (0.79) on the analogous single-variable specification, and reflects both the small sample size and the deliberate sample bias toward higher-priced lots. The reported size elasticity of β ≈ 0.61 should therefore be treated as a directional finding pending replication on a larger dataset.
© 2025-2026. All rights reserved.
Centro Research
info@centroresearch.eu
Investment research of securities and markets
Reports and other shared materials should not constitute as financial advice. Investment decisions require individual due diligence and one should seek qualified counsel.